
Rent takes a big bite out of many budgets these days. For households struggling to get by, paying rent every month can feel nearly impossible. Income-restricted apartments are meant to help with that. They keep rent at a level tied to local earnings, so lower-income households can cover housing on a manageable percentage of their paycheck.
The problem is that there just aren’t nearly enough of these apartments. The National Low Income Housing Coalition reports only 35 affordable and available rental homes for every 100 extremely low-income renter households, based on the most recent year’s Census data.
New data pulled from Apartments.com’s active listings shows how low availability looks today for renters. Only 4.6 percent of listings across the 50 largest U.S. metro areas were income-restricted* in Q3 2026, based on a sample of more than 70,000 active listings out of Apartments.com’s full inventory. That’s fewer than 1 in 20.
*Income-restricted means a listing flagged as reserved for renters under an income limit, whether through public housing, a housing voucher, or a tax-credit (LIHTC) property.
The most expensive markets tend to have the smallest share of income-restricted listings. In all seven of the priciest markets we analyzed, from San Francisco to Miami, that share falls below the 4.6 percent average.
Your odds can change a lot depending on where you live, though. Some metros have far more options than others, and a few are even seeing income-restricted rents come down. Then there’s Washington, D.C., one of the priciest markets in the country, yet home to more income-restricted listings than any other market we analyzed.
Here’s where to look when searching for income-restricted listings.
Key Takeaways
- Washington, D.C., has 227 income-restricted listings, the highest count of all 50 U.S. metro areas measured.
- San Antonio, TX has 106 income-restricted listings, 12.4 percent of its total listings. That’s the highest ratio of income-restricted listings to overall listings in all the 50 markets we analyzed.
- Income-restricted rents average $988 per month in Detroit, MI, the lowest price among the 50 markets measured. Average income-restricted rent fell year over year in 13 of the 50 markets, compared with just three for market-rate rent.
Low-Income Households Have Options, but the Choice of Listings Is Slim
Income-restricted housing covers a handful of programs, and most of them run through the U.S. Department of Housing and Urban Development (HUD). Who qualifies depends on your local housing authority. Most programs serve households earning below the area median income, and many also prioritize seniors and people with disabilities. The two you’ll hear about most are:
- Public housing: Housing funded by HUD and managed by local Public Housing Agencies, which set rent at a price these households can afford.
- Housing Choice Vouchers: Also known as Section 8 vouchers, these help low-income families, older adults, and people with disabilities afford housing in the private market. These vouchers help pay a portion of someone’s rent, though not all landlords accept them.
Demand for both programs outpaces the funding behind them, so families often wait years for a voucher. And income-restricted units themselves make up a small slice of the rental market.
Some metros have a lot more to choose from, though. In the Q3 2026 sampling of Apartments.com listings, the Washington, D.C., area has 227 income-restricted listings available, the most of any metro we looked at. Those units averaged $1,826 a month in Q3 2026, $454 less than the area’s market-rate average of $2,280.
Every metro ranked in the top 10 has at least 100 income-restricted listings. The list covers a lot of ground, too, from pricey coastal hubs like Seattle and San Francisco to lower-cost Texas metros like Houston and San Antonio.
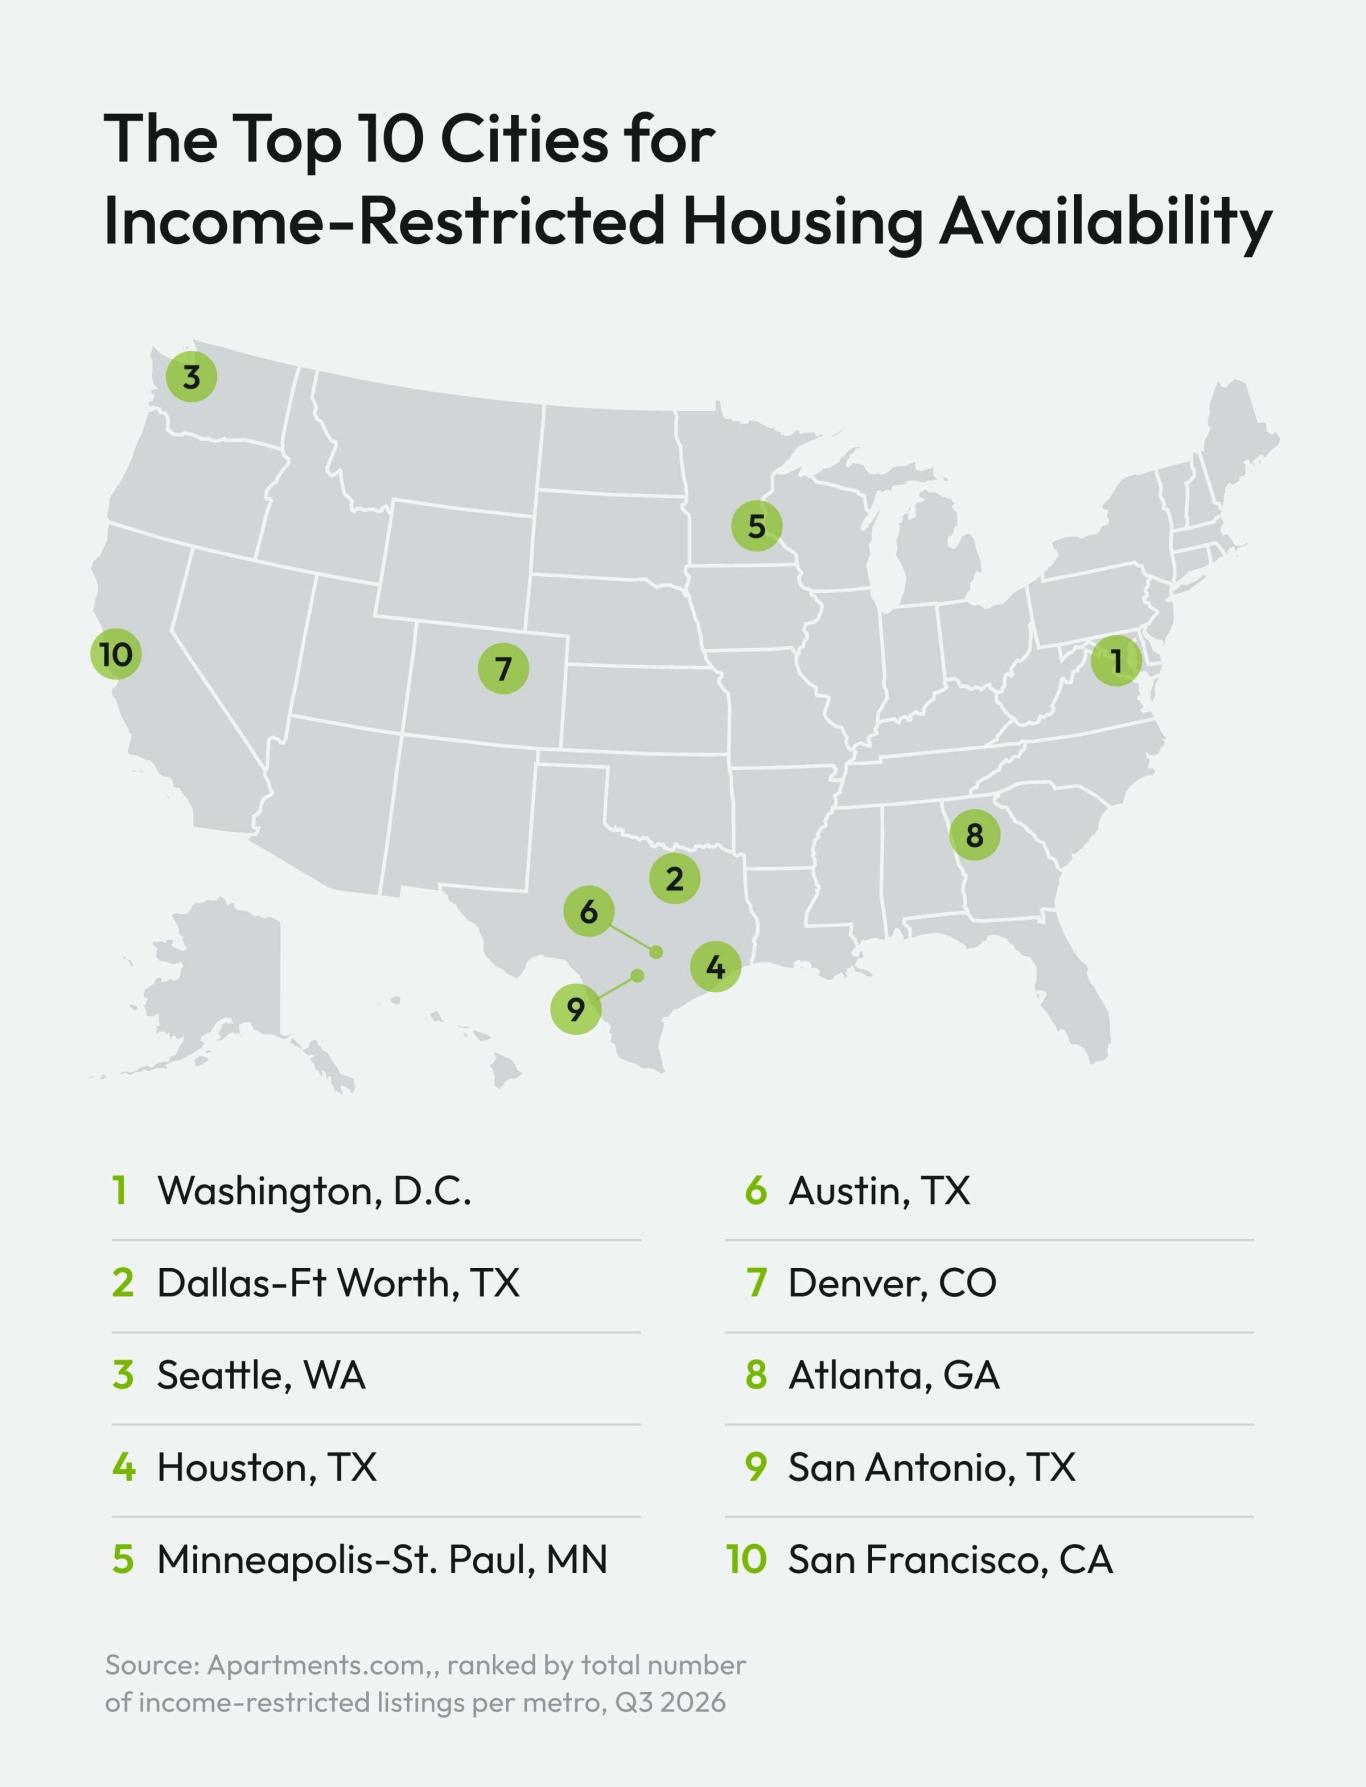
Unfortunately, just because a city has more affordable housing listings doesn’t mean it’s easy to rent one. HUD’s multifamily property search shows more than 17,000 HUD-assisted rental units in the D.C. area. That’s a large pool of subsidized housing, but it’s also a sign of how much competition exists for it. A couple hundred open listings disappear fast in a metro that size. That’s why every extra option matters for renters who qualify.
Some cities offer a better ratio of income-restricted to overall listings
Big metros have more listings of every kind, so they’ll always look strong on raw counts. The share of listings that are income-restricted says more about your actual odds when you start searching.
San Antonio is the standout here. It has 106 income-restricted listings, almost the same as the San Francisco Bay Area’s 104. In San Antonio, though, those listings make up 12.4 percent of everything available. In the Bay Area, it’s only 4.2 percent. The odds of finding a listing are roughly three times higher, even though there’s practically the same number of options.
The four metros with the highest share are all in Texas and Virginia, where market-rate rents also run lower than in big Northeast and West Coast cities:
- San Antonio, TX: 12.4 percent
- Austin, TX: 11.7 percent
- Richmond, VA: 10.1 percent
- Norfolk, VA: 10 percent
Income-Restricted Housing Saves Households Money, and Some Rents Are Actually Falling
The savings add up quickly in some cities. Averaged across all 50 metros, income-restricted rent came to $1,448 a month in Q3 2026. Market-rate rent averaged $1,756. That's about $308 a month on average, or roughly $3,700 a year.
In expensive cities, the difference is substantial. Boston comes out on top. Income-restricted listings there average $816 less than market-rate ones, which rank among the highest in the country. Chicago ($772) and New York ($679) aren’t far behind.
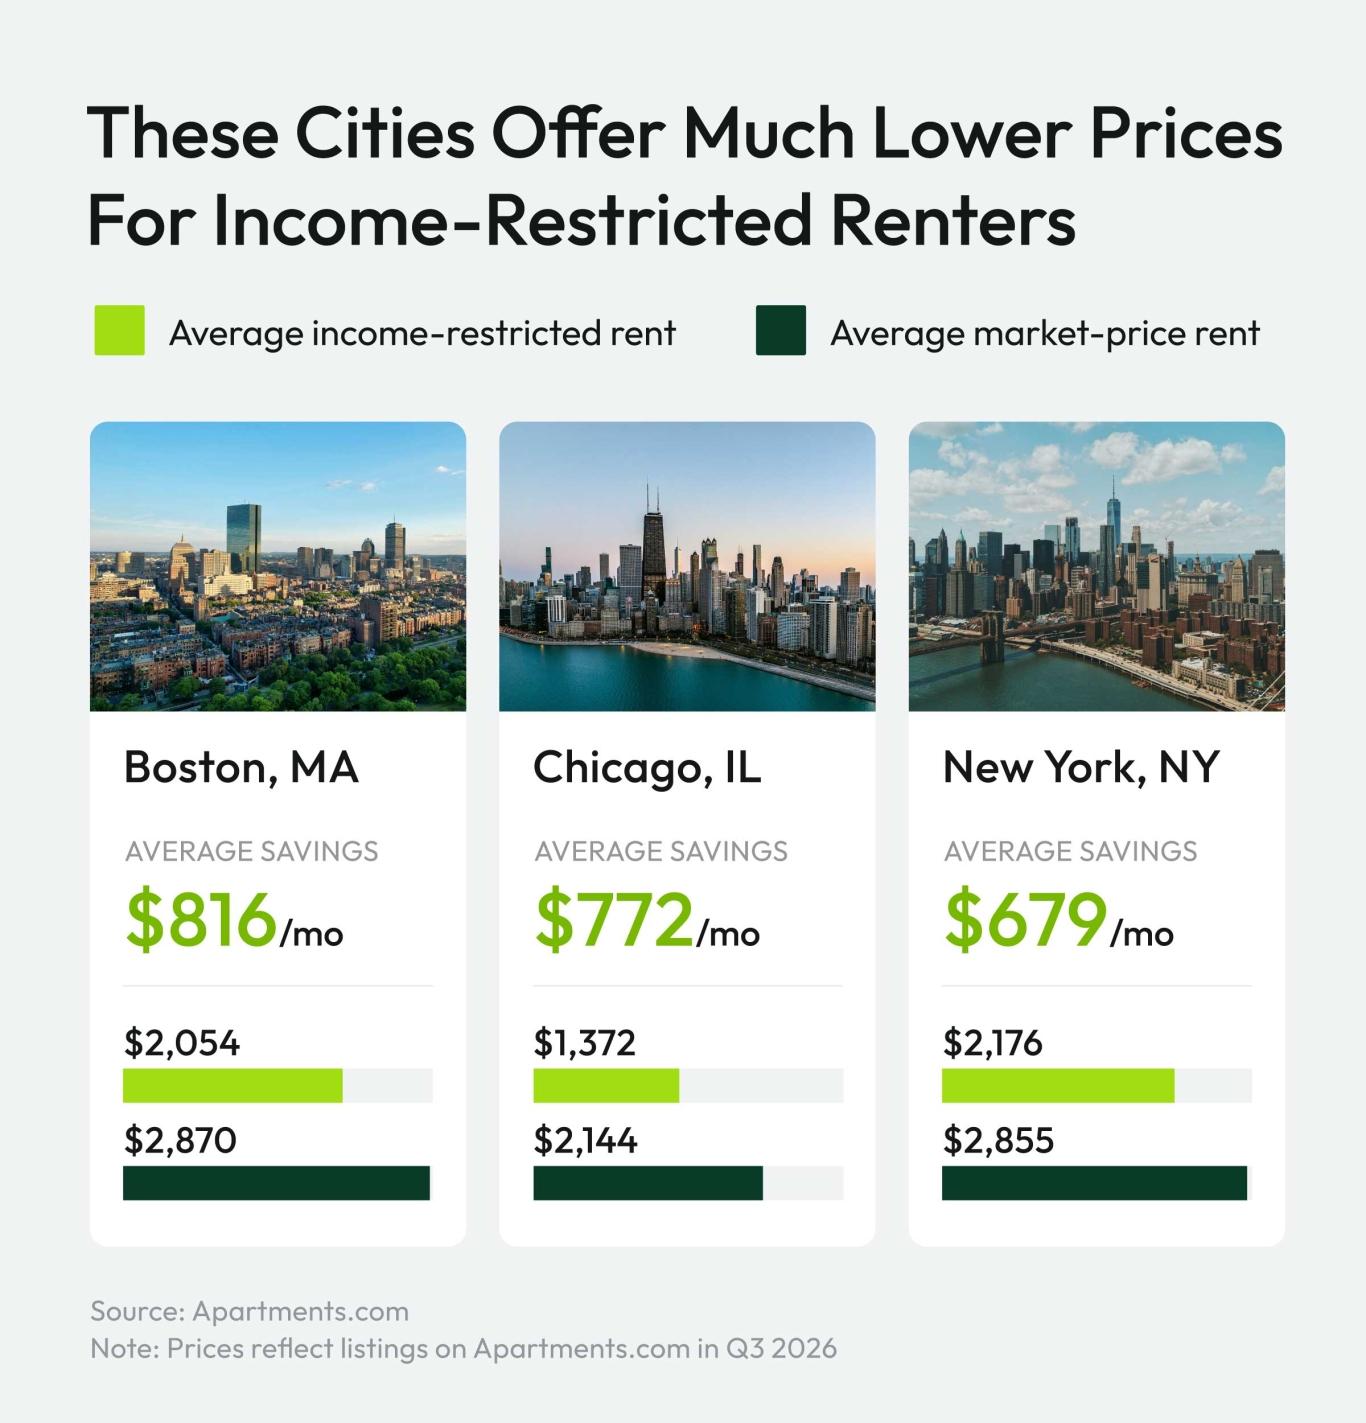
Prices are heading the right way in some places, too. Income-restricted rents fell year over year in 13 of the 50 metros, while market-rate rents fell in just three. In Austin, income-restricted rent dropped 7.4 percent between Q3 2025 and Q3 2026, or about $106 a month, even as market-rate rent in the city rose 1.3 percent.
Income-restricted rents are rising in some Midwest cities, though, sometimes even faster than in market-rate units. In Grand Rapids, Michigan, income-restricted rent jumped 17.4 percent, while market-rate rent rose 2.6 percent.
In the country’s priciest metros, however, the income-restricted savings still help renters where they need it most. Everyday costs run well above average in Boston and Chicago, and even higher in New York City, so renters there feel every grocery run and utility bill. Shaving a few hundred dollars off rent doesn’t erase those expenses, but it buys some breathing room once you add up the total cost of renting an apartment.
4 Resources for Finding Affordable Housing Near You
Finding affordable housing near you isn’t impossible, but it can be tricky. These resources can help.
- Find out if you qualify. A HUD-approved housing counselor can walk you through eligibility and help you sort out which programs fit your situation.
- Look up programs in your state. HUD keeps rental help and local contacts for every state in one place.
- Call your city’s housing department. Many cities also have services beyond those offered by HUD. They can also point you to resources for tenant rights or eviction prevention.
- Search with your budget in mind. Apartments.com’s AI-powered search lets you look for income-restricted listings or stay within a set budget. It also lists full housing costs, including utilities and fees, so pricing stays transparent, and you know what you’ll really pay each month.
Income-restricted apartments are out there, and in some metros, they’re getting cheaper. Explore more with Apartments.com to find a rental that fits your budget.
Methodology
Apartments.com analyzed more than 70,000 out of over a million active rental listings across the 50 largest U.S. media markets, then grouped them by whether each listing was flagged as income-restricted. Listing counts reflect active listings as of Q3 2026. Average rents compare Q3 2025 with Q3 2026 (quarter-to-date) for income-restricted and market-rate listings in each metro. National averages represent the average of all 50 metro-area figures. The national income-restricted share (4.6 percent) is calculated as the total number of income-restricted listings divided by the total number of listings across all 50 metros combined, rather than an average of each metro’s individual share. This keeps larger markets from being under-weighted relative to smaller ones. Metro areas follow Apartments.com’s market definitions, which can include surrounding cities, and results reflect listings on Apartments.com rather than a metro’s total housing supply.


