

Key Takeaways
- The national average rent was $1,645 per month, an increase of 0.4% over the last year.
- Southwest Florida leads the way in rent declines, with Fort Myers at the forefront.
- Rents in the San Francisco metro area continue to surge and are currently 11.2% higher than last year.
In June, the national average rent was $1,645 per month for a one-bedroom and $1,909 per month for a two-bedroom, an increase of 0.4% from June 2025. The national vacancy rate dropped slightly to 8.3%, exactly where it was a year ago.
Silicon Valley Rent Surges
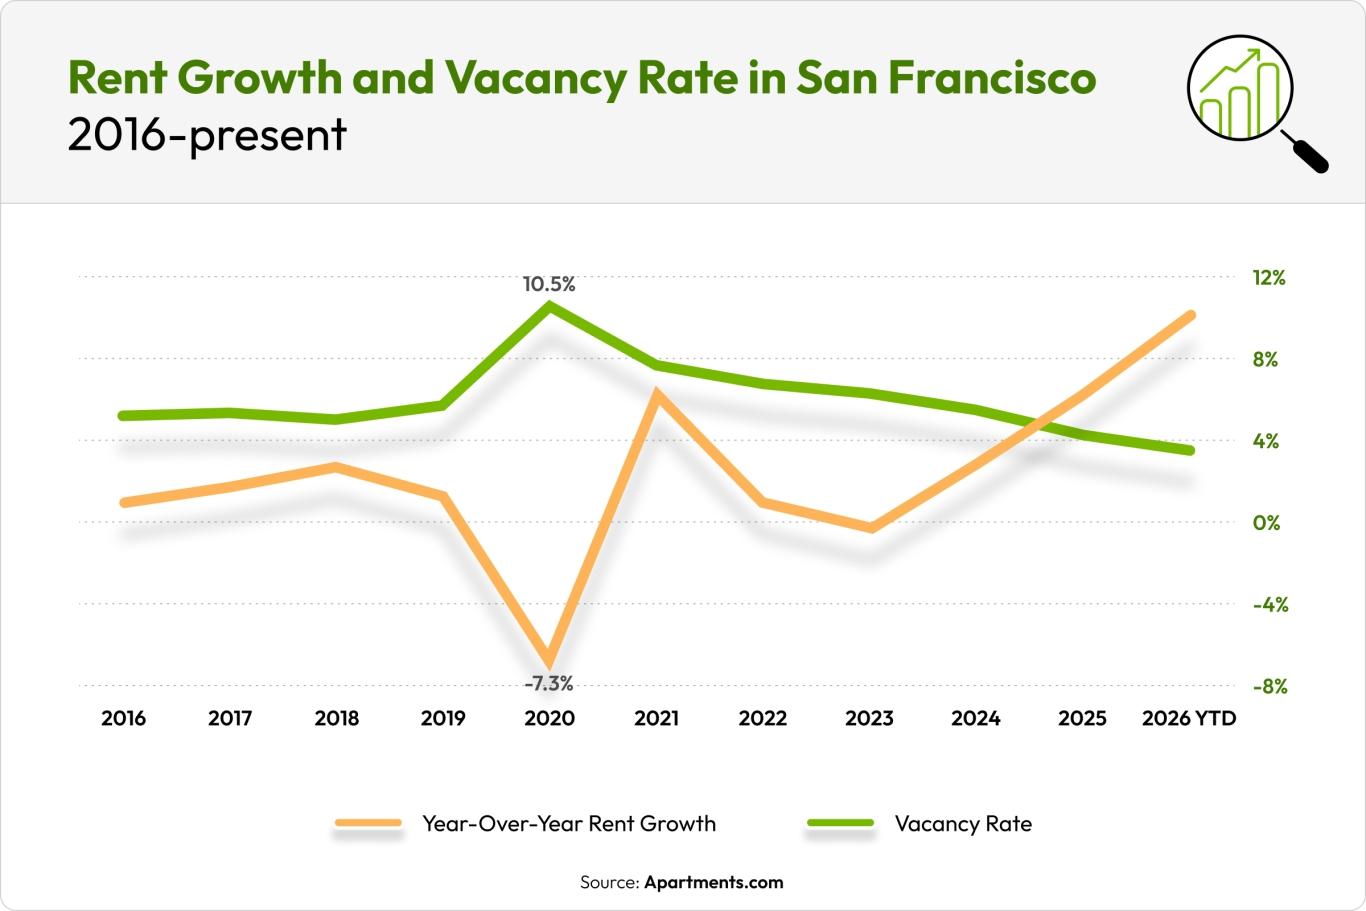
Unlike many Sun Belt cities where a wave of new apartment construction has softened rents, San Francisco is seeing rising rents, tightening vacancies, and renewed renter demand driven by the AI boom and a gradual return to office work.
The rapid growth of AI companies like OpenAI, Anthropic, and Databricks is bringing high-income workers back into the city. Many of these companies are expanding office footprints in SoMa and the Financial District, increasing demand for nearby housing.
In response, rents began to surge and vacancy rates began to drop near the end of 2024 as tech startups popped up around the Bay Area. Despite a solid construction pipeline, the average rent for a 1-bedroom apartment in San Francisco has increased by 11.2% since last year and by more than 17% since the release of ChatGPT in November 2022.
June 2026 Rent Growth
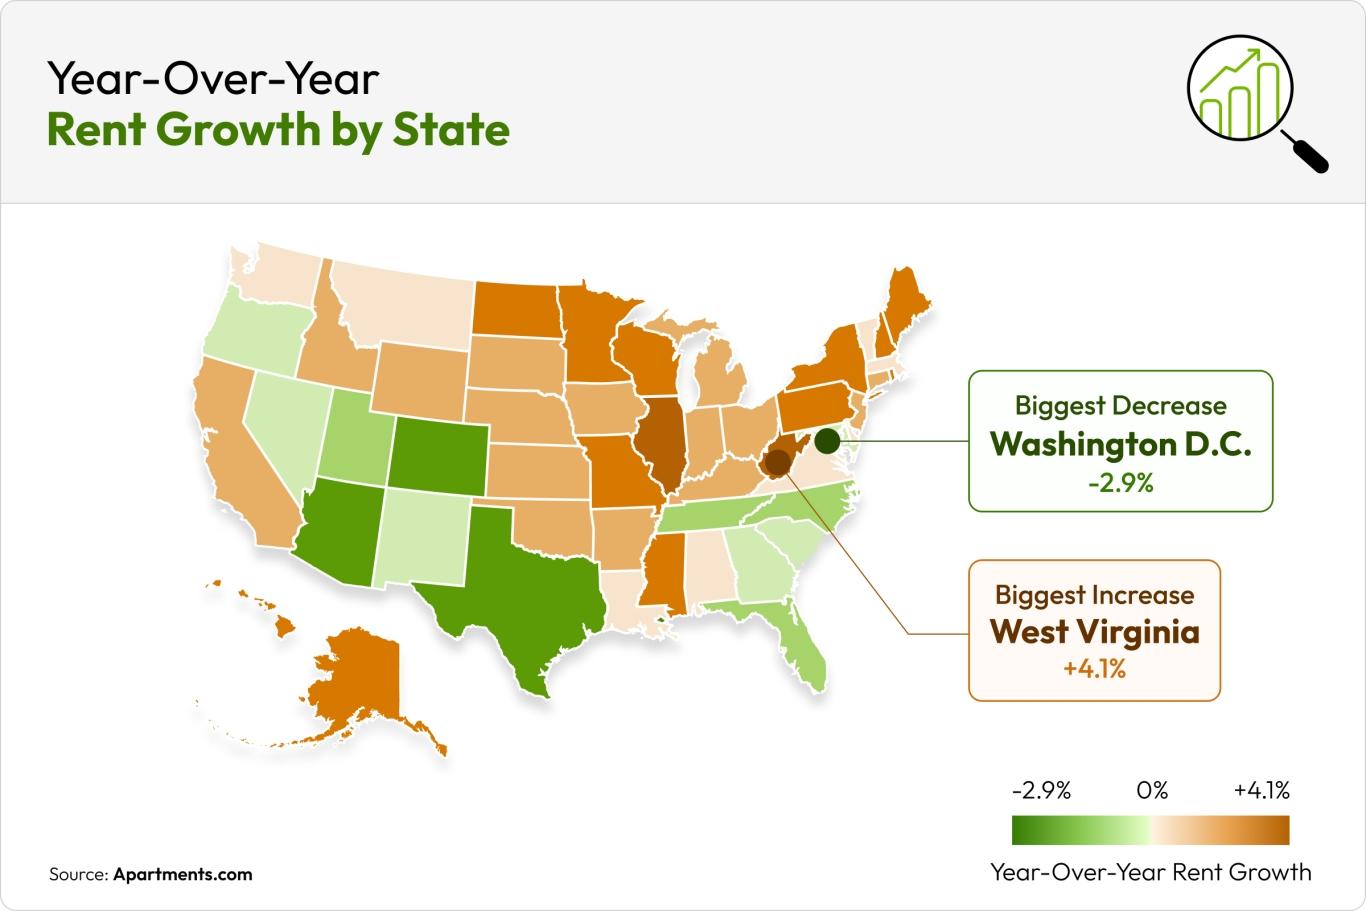
West Virginia had the greatest year-over-year increase at 4.1%, and Washington, D.C. had the largest decrease at -2.9%.
June 2026 rent increases by city
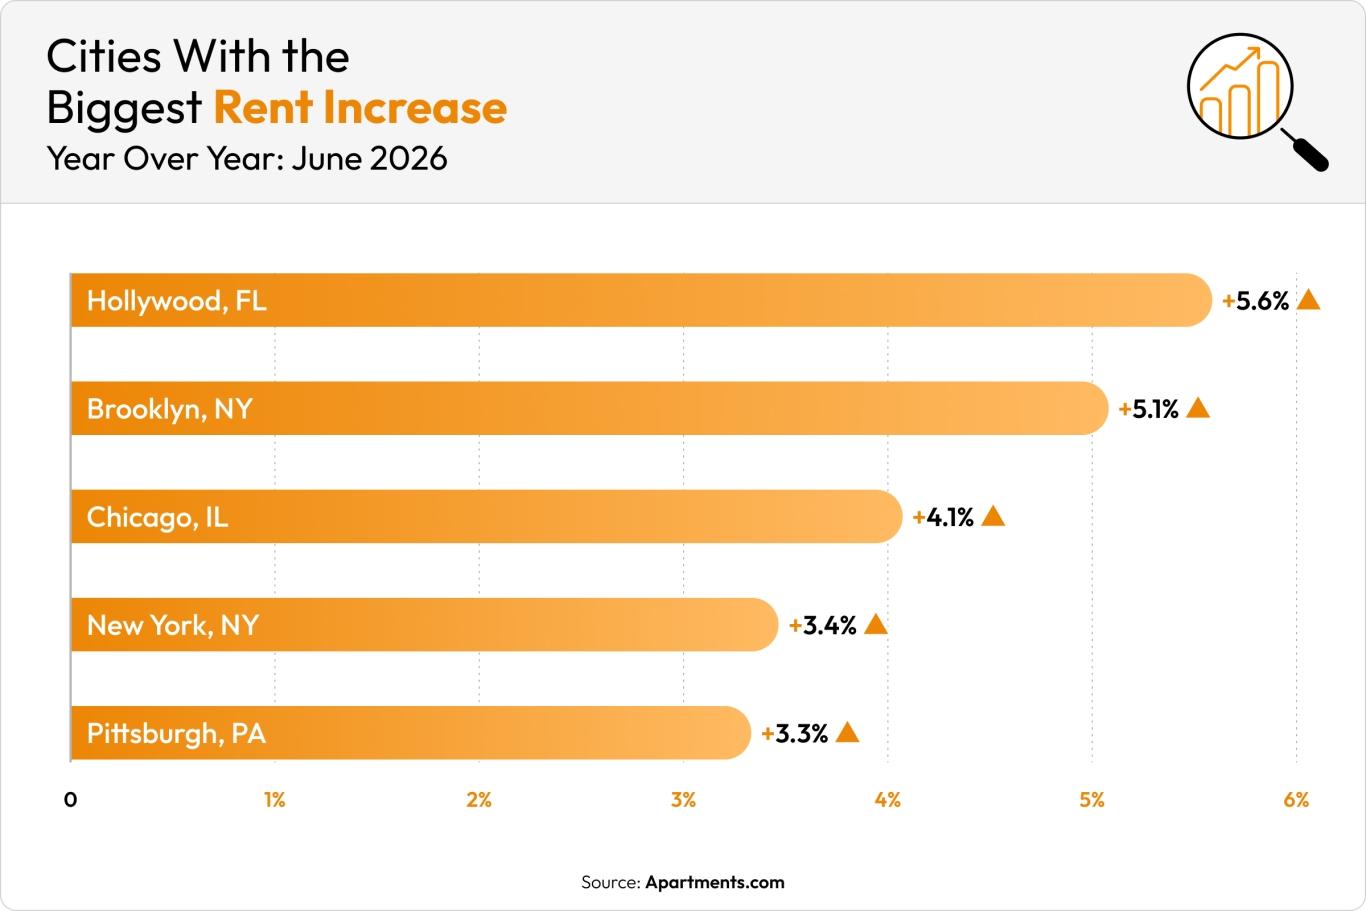
Rents have been heating up at the start of summer moving season, with Hollywood, FL, leading the way at a 5.6% increase over last year.
Here are the cities with the biggest rent increases in June:
- Hollywood, FL: +5.6%
- Brooklyn, NY: +5.1%
- Chicago, IL: +4.1%
- New York, NY: +3.4%
- Pittsburgh, PA: +3.3%
June 2026 rent decreases by city
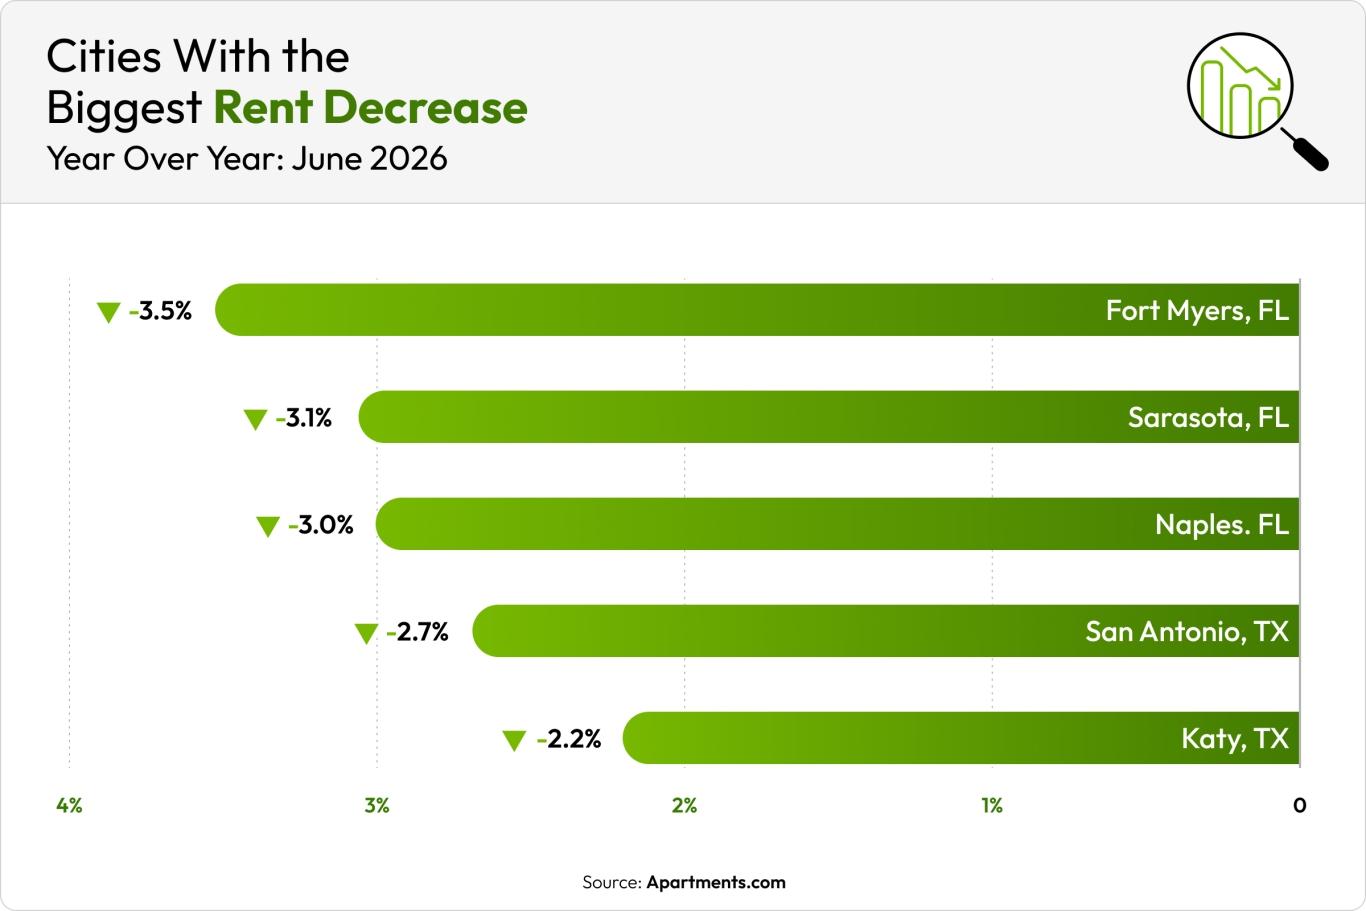
Southwest Florida remains in the lead for rent decreases, with Fort Myers, Sarasota, and Naples occupying the top three spots for the second month in a row.
Here are the cities with the biggest rent decreases in June:
- Fort Myers, FL: -3.5%
- Sarasota, FL: -3.1%
- Naples, FL: -3.0%
- San Antonio, TX: -2.7%
- Katy, TX: -2.2%
Current Rent Prices Across the U.S.
|
City |
Current Average Rent |
Last Month’s Average Rent |
Year-Over-Year Difference |
|
$2,387 |
$2,373 |
-0.2% |
|
|
$1,645 |
$1,635 |
+0.5% |
|
|
$1,411 |
$1,394 |
-2.5% |
|
|
$3,614 |
$3,583 |
+2.3% |
|
|
$1,638 |
$1,636 |
+0% |
|
|
$3,050 |
$3,025 |
+1.7% |
|
|
$1,929 |
$1,880 |
+2% |
|
|
$1,481 |
$1,475 |
-1.5% |
|
|
$2,055 |
$2,046 |
+3.8% |
|
|
$1,141 |
$1,145 |
+1% |
|
|
$1,299 |
$1,300 |
-1.6% |
|
|
$1,185 |
$1,174 |
+0.6% |
|
|
$1,416 |
$1,411 |
-0.6% |
|
|
$1,634 |
$1,627 |
-2.7% |
|
|
$2,277 |
$2,295 |
+0.2% |
|
|
$1,271 |
$1,268 |
-1.8% |
|
|
$3,843 |
$3,821 |
+2.9% |
|
|
$1,753 |
$1,733 |
+0.8% |
|
|
$1,184 |
$1,184 |
-1.3% |
|
|
$1,134 |
$1,123 |
+0.6% |
|
|
$2,961 |
$2,930 |
+1.1% |
|
|
$1,307 |
$1,306 |
+0.1% |
|
|
$3,281 |
$3,257 |
+2.3% |
|
|
$1,262 |
$1,254 |
+2.3% |
|
|
$1,277 |
$1,281 |
-2.6% |
|
|
$1,834 |
$1,828 |
+0.5% |
|
|
$2,185 |
$2,180 |
-0.4% |
|
|
$1,521 |
$1,515 |
+0.8% |
|
|
$2,243 |
$2,237 |
+0.7% |
|
|
$1,220 |
$1,215 |
+2.7% |
|
|
$1,424 |
$1,417 |
+2.3% |
|
|
$1,693 |
$1,681 |
-2.2% |
|
|
$4,183 |
$4,141 |
+3% |
|
|
$1,591 |
$1,581 |
-0.8% |
|
|
$1,785 |
$1,781 |
+1.7% |
|
|
$1,300 |
$1,301 |
-3.6% |
|
|
$1,442 |
$1,420 |
+1.8% |
|
|
$1,523 |
$1,520 |
-0.6% |
|
|
$3,588 |
$3,557 |
+2.6% |
|
|
$1,393 |
$1,383 |
-1.2% |
|
|
$1,440 |
$1,443 |
+0.7% |
|
|
$1,578 |
$1,574 |
-0.9% |
|
|
$1,158 |
$1,151 |
+1.8% |
|
|
$1,072 |
$1,072 |
-3.8% |
|
|
$2,413 |
$2,397 |
-0.2% |
|
|
$3,469 |
$3,396 |
+11.2% |
|
|
$2,816 |
$2,756 |
+5.3% |
|
|
$2,113 |
$2,099 |
-0.4% |
|
|
$1,654 |
$1,645 |
-1.9% |
|
|
$2,279 |
$2,266 |
-1.5% |
How Current Rent Prices Impact Renters
Timing is key when you’re searching for a new place. Rent prices are always fluctuating, and summer is a peak demand time. Fall and winter are typically the best times to find cheap rent, but the current plateau and the forecasted rise in rents may mean that renters will get the best deals now. Keep an eye out for rent concessions like waived application fees or a free month of rent.
Need help comparing cities? Our Cost of Living Calculator makes it easy. You can also compare the rent prices from this report to those from May and April to determine the overall trend and visit the U.S. Rent Trends page to view the most current rent prices available across the U.S.
Methodology:
The rent data in this report is sourced from CoStar Group’s Market Trend reports. CoStar Group is the leading authority in commercial real estate information, analytics, and news, trusted by real estate professionals for more than 37 years. By combining this data with Apartments.com internal data and public record, we’re able to deliver the most up-to-date rental information available.
To determine overall rent trends, we evaluate rent prices from more than 2,400 cities across the nation, including the top 80 national markets. This analysis includes year-over-year and month-over-month rent changes to provide a comprehensive view of market dynamics. This report covers a diverse range of property types to ensure a holistic view of the rental market.
FAQs
What is the average rent in the U.S. right now?
The average rent in the U.S. is currently $1,661 per month, a year-over-year increase of 0.7%.
Which states had the largest rent increases in June 2026?
The states with the largest rent increases in June were West Virginia, Illinois, and Hawaii. West Virginia’s rent increased by 4.1% compared to last year, Illinois’ average rent increased by 3.5%, and Hawaii’s average rent increased by 2.6%.
Which states have the cheapest rent right now?
The states with the cheapest rent are Oklahoma, Arkansas, and North Dakota. Oklahoma has the cheapest rent in the U.S. at $920/month, a 0.3% increase over last year.
Are rent prices rising or falling in the U.S.?
Rent prices in the U.S. are rising, averaging 0.7% more than last year.


