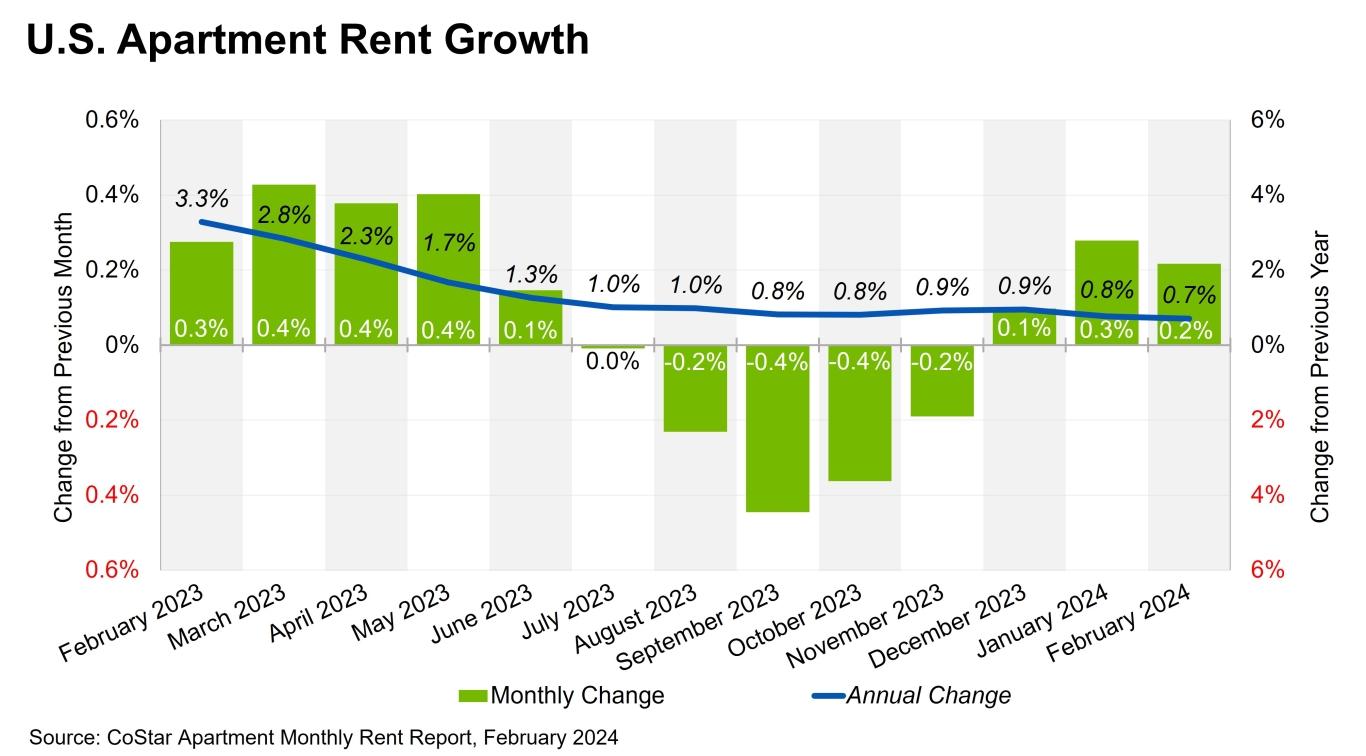
Rent prices are leveling off, which is good news for renters. Rent growth slowed to just 0.2%, according to the Apartments.com Monthly Rent Report. After only a slight increase in January, this could indicate a cooling of the market. The slowdown is especially notable when you look at the year-over-year figures. February’s year-over-year rent growth was 0.7%, marking the slowest annual gain since the middle of 2020. Annual rent increases have slowed by almost 300 basis points since January 2023. There continues to be a mismatch between supply and demand, especially in the Sun Belt region, leading to higher-than-average vacancy rates. In many locations, vacancy rates are as high as 14 percent.
The Midwest Continues to Outshine the Sun Belt
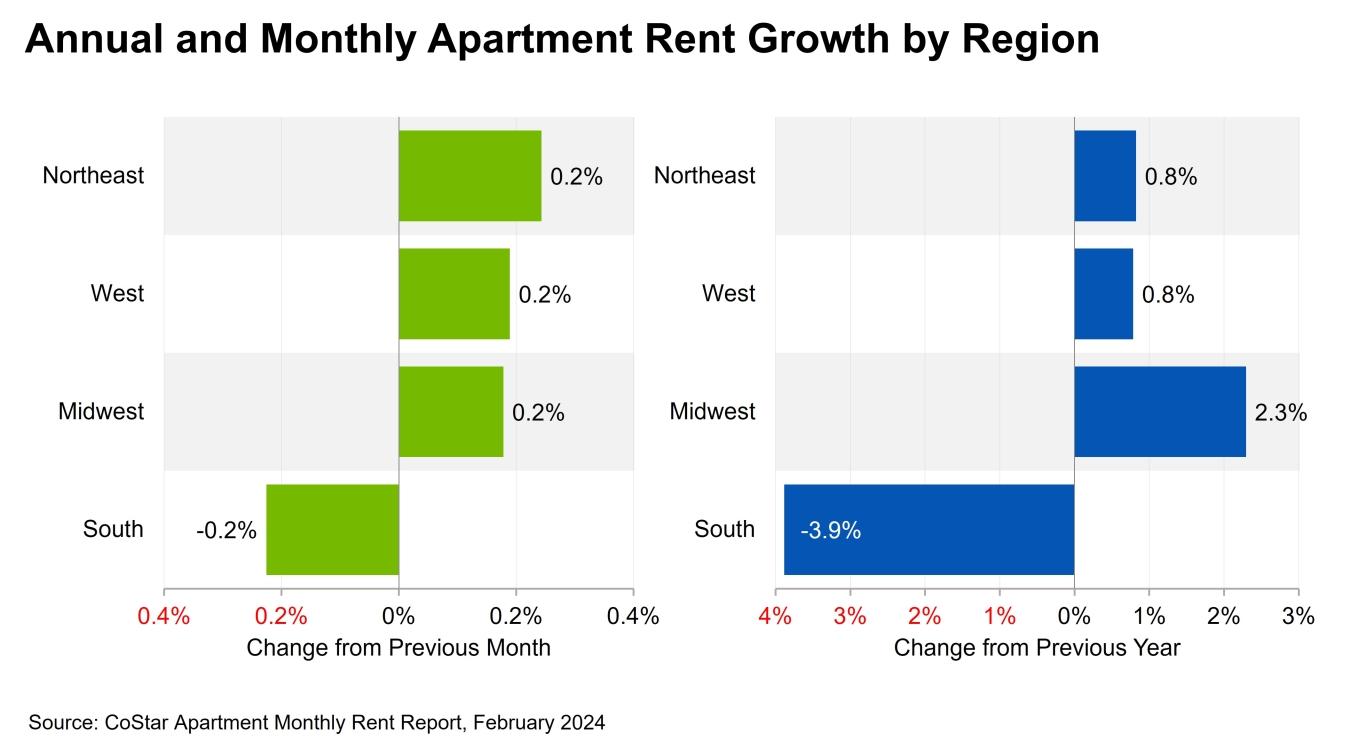
For the past several months, the big story has been the Midwest. Rent prices continue to climb in the region, rising from 0.1% in January to 0.2% in February. Rent in the West also rose by 0.2%. Rent prices fell in the Northeast from 0.4% in January to 0.2% in February. The best place for renters continues to be the South. In January, rent prices were flat. This month, they dipped slightly by 0.2%.
Looking at the bigger picture, year-over-year, every region is experiencing a bit of a slowdown, with rent prices cooling off from 0.4% in January to 0.2% in February. Renters in the South are seeing rent prices fall, down 3.9%, a slightly bigger dip than last month’s -3.6%. Rent growth slowed down in the west, with annual rent growth in February halved from 0.8% from January’s 1.6%.
Cities with the Biggest Rent Increases
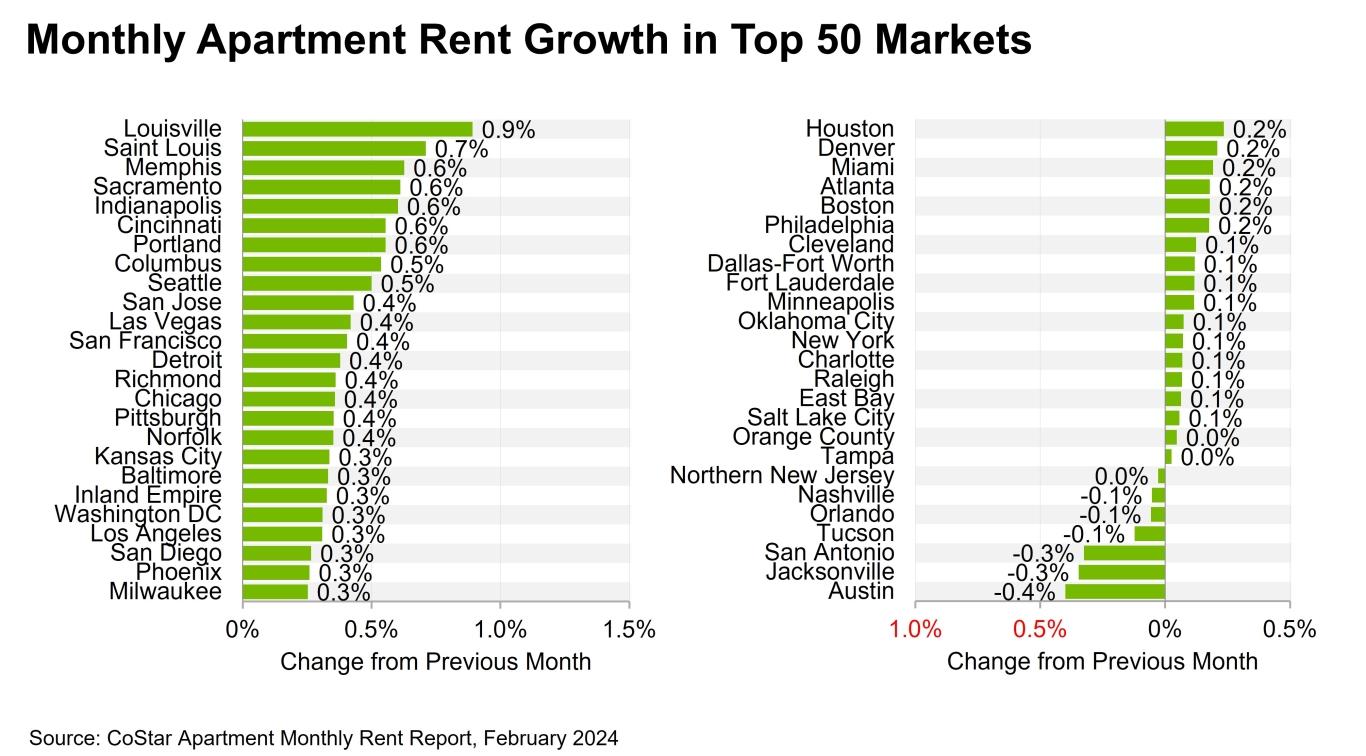
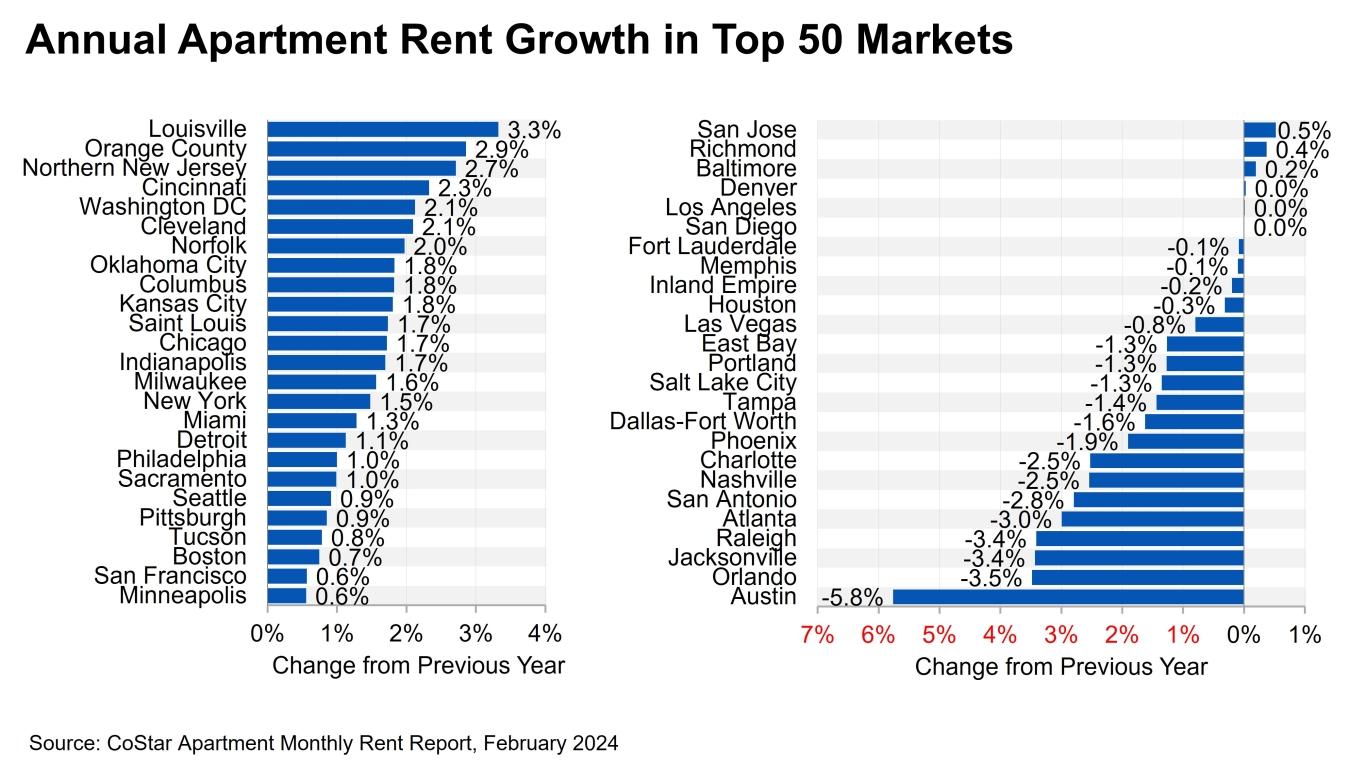
Unlike renters in many other parts of the country, those in Louisville, Kentucky aren’t benefitting from falling rent prices. Louisville had the strongest month-over-month rent growth in February, up 0.9% compared to the 0.8% increase in January. And while Louisville slipped to third last month for largest increases, topped by San Francisco, California and Richmond, Virginia, it is once again topping the list. In fact, when compared to last year, Louisville has seen rent prices rise higher than any other city. Renters are paying 3.3% more in rent now than they were last year. Louisville is followed by Orange County, Northern New Jersey, and Cincinnati for the largest rent increases compared to last year.
Cities in the Midwest like Saint Louis, Indianapolis, Cincinnati, and Columbus are also seeing higher rent prices. However, many of the cities with the highest rent increases last month saw smaller increases in February. Rent growth in Richmond, Virginia fell from 0.9% in January to 0.4% in February. San Francisco saw rent increases slow, as well, down 0.4% in February compared to 0.8% in January. Other cities that saw rent prices dip in February included San Jose, Norfolk, Seattle, and the Inland Empire.
Here are the five cities with the biggest rent increases for February 2024:
- Louisville, Kentucky (+0.9%)
- Saint Louis, Missouri (+0.7%)
- Memphis, Tennessee (+0.6%)
- Sacramento, California (+0.6%)
- Indianapolis, Indiana (+0.6%)
Cities with the Biggest Rent Declines
Last month, the best city for lower rent prices was San Antonio, Texas. While San Antonio is still in the top five cities with the biggest rent decreases, another Texas city is topping the list for February: Austin. Rent prices continue to fall in Austin, where rent prices were down 0.4% in February. Jacksonville, Florida moved from one of the cities with the biggest rent gains in January to the city with the second largest rent decline at 0.3%. Even though San Antonio dropped a few spots, it rounds out the top three with a -0.3% drop in rent prices.
When compared to last year, Austin has seen the largest decrease in rent prices, down 5.8%. To put that in perspective, the city with the next largest decrease in rent prices compared to last year is Orlando, Florida, with a drop of 3.5%. Jacksonville, Florida rounds out the top three cities with the largest decreases in rent prices at -3.4%.
Here are the five cities with the biggest rent declines for February 2024:
- Austin, Texas (-0.4%)
- Jacksonville, Florida (-0.3%)
- San Antonio, Texas (-0.3%)
- Tucson, Arizona (-0.1%)
- Orlando, Florida (-0.1%)
A Shift Toward Balance
Only 29 of the top 50 markets in the US saw positive annual rent growth in February, and growth was slower in almost all 50 markets. This slowdown in rent growth could indicate a normalizing of the market overall. Rent prices should become far less volatile than they were in 2023, bringing a welcome steadiness to the rental market. However, there are significant regional variations. Renters in cities like Austin, Orlando, Jacksonville, and Raleigh might have an easier time finding affordable rent options. However, in places like Louisville, Cincinnati, Northern New Jersey, and Washington DC, finding a rental within your budget might continue to prove difficult. In places that have seen sharp increases in rent, affordability issues may persist even with the slowdown in rent growth.
Current Rent Prices Across the US
Want to see what rents are doing where you live? Here’s a look at current rent prices in cities across the country:
|
City |
Current Average Rent |
Last Month’s Average Rent |
Year-Over-Year Difference |
|
$2,238 |
$2,225 |
+3.73% |
|
|
$1,552 |
$1,548 |
-5.43% |
|
|
$1,438 |
$1,444 |
-7.46% |
|
|
$3,314 |
$3,309 |
+0.53% |
|
|
$1,578 |
$1,563 |
+0.42% |
|
|
$2,652 |
$2,644 |
+1.39% |
|
|
$1,683 |
$1,700 |
-1.78% |
|
|
$1,416 |
$1,415 |
-3.37% |
|
|
$1,790 |
$1,778 |
+0.75% |
|
|
$1,024 |
$1,026 |
+1.23% |
|
|
$1,309 |
$1,301 |
-1.43% |
|
|
$1,081 |
$1,068 |
+0.58% |
|
|
$1,356 |
$1,357 |
-2.51% |
|
|
$1,680 |
$1,672 |
-0.01% |
|
|
$2,157 |
$2,133 |
-0.20% |
|
|
$1,232 |
$1,222 |
-2.34% |
|
|
$3,515 |
$3,495 |
+1.65% |
|
|
$1,652 |
$1,639 |
+0.62% |
|
|
$1,152 |
$1,149 |
-0.33% |
|
|
$1,042 |
$1,039 |
+1.10% |
|
|
$2,799 |
$2,831 |
+2.97% |
|
|
$1,276 |
$1,279 |
-4.12% |
|
|
$2,976 |
$2,942 |
+0.28% |
|
|
$1,119 |
$1,117 |
+0.72% |
|
|
$1,246 |
$1,241 |
-2.06% |
|
|
$1,718 |
$1,714 |
+0.43% |
|
|
$2,092 |
$2,078 |
-0.88% |
|
|
$1,378 |
$1,364 |
+4.73% |
|
|
$2,051 |
$2,043 |
+1.54% |
|
|
$1,102 |
$1,099 |
+1.61% |
|
|
$1,321 |
$1,315 |
+0.54% |
|
|
$1,589 |
$1,595 |
-4.38% |
|
|
$3,748 |
$3,689 |
+1.84% |
|
|
$1,546 |
$1,548 |
-3.73% |
|
|
$1,644 |
$1,642 |
-0.56% |
|
|
$1,310 |
$1,311 |
-2.94% |
|
|
$1,267 |
$1,262 |
+0.54% |
|
|
$1,460 |
$1,455 |
-2.13% |
|
|
$2,322 |
$2,320 |
+2.42% |
|
|
$1,340 |
$1,339 |
-5.33% |
|
|
$1,302 |
$1,301 |
+0.49% |
|
|
$1,493 |
$1,481 |
-0.40% |
|
|
$1,051 |
$1,041 |
+0.85% |
|
|
$1,073 |
$1,073 |
-3.50% |
|
|
$2,248 |
$2,234 |
-1.59% |
|
|
$2,822 |
$2,813 |
-0.11% |
|
|
$2,466 |
$2,457 |
+0.31% |
|
|
$1,986 |
$1,981 |
+0.48% |
|
|
$1,582 |
$1,585 |
-1.71% |
|
|
$2,226 |
$2,223 |
+0.73% |
How Current Rent Prices Impact Renters
The construction surge during the pandemic is resulting in an increase in available apartments, particularly in the Sun Belt region. Since the demand for apartments in this region has cooled post-pandemic, many Sun Belt cities are seeing higher vacancy rates. The vacancy rate in Austin, for example, has soared to 14.7%, the highest nationwide and significantly above the national average of 8%. Other cities with notable vacancy rates include Memphis, Tennessee; Jacksonville, Florida; Raleigh, and Charlotte, North Carolina, all exceeding 14%. If you're living in or considering moving to these cities, keeping an eye on the vacancy rate and rent trends can help you get the most for your money. Compare the rent prices from this report to those from January and December to determine the overall rent trend in your area, and visit the US Rent Trends page to view the most current rent prices available in cities across the US based on CoStar data.


