

The second quarter of 2026 marks the first period since the fall of 2021 that lease-ups outpace new apartment supply. Vacancy rates are beginning to stabilize, rent growth remains gradual, and construction activity is cooling off, making for a softer summer moving season than in years prior.
Whether you’re considering a move or bracing for lease renewal, understanding where rents are rising and falling and how trends will impact your search can help you make more informed decisions in the evolving rental landscape.
Where Rents Are Rising
The San Francisco Bay Area
Rents continue to rise all around the San Francisco Bay Area amid the AI boom. While San Francisco has been the eye of the hurricane, neighboring cities are also experiencing the pressure of increased demand.
Rents in cities across the Bay Area soar above the California average rent, and rent increases in this region outpace the rest of the state. San Jose, Fremont, and Oakland in particular have absorbed much of the demand outside of San Francisco city limits.
|
City |
Current Average Rent |
Year-Over-Year Difference |
|
$2,26 |
+2.1% |
|
|
$3,530 |
+11.4% |
|
|
$2,838 |
+6.4% |
|
|
$2,208 |
+3.9% |
|
|
$2,620 |
+4.1% |
|
|
$3,448 |
+7.1% |
|
|
$3,146 |
+7.1% |
|
|
$2,302 |
+3.1% |
|
|
$3,538 |
+8.7% |
|
|
$2,755 |
+1.7% |
|
|
$3,221 |
+8% |
|
|
$3,104 |
+3.3% |
|
|
$2,578 |
+3.3% |
|
|
$3,481 |
+6.3% |
|
|
$2,549 |
+5.5% |
|
|
$1,810 |
+6.8% |
|
|
$2,541 |
+4.4% |
Chicago metro area
Chicago’s average rent is currently 4.4% higher than last year, marking one of the steepest rent increases across U.S. metro areas.
This is largely due to limited new supply across the city. Construction activity in Chicago cooled off mid-2024, but demand remained steady. Additionally, the majority of construction over the last year has been concentrated around Downtown Chicago, where the average 1-bedroom rent is about 40% higher than the city average. The combination of decreased construction and an increased portion of new builds entering the market at a higher price has caused Chicago’s average rent to inch upward.
Baltimore
While rents aren’t rising as aggressively as in other parts of the country, Baltimore renters are still seeing a steady increase that outpaces the national average.
Despite an increased supply and subdued demand, Baltimore’s average rent is 1.4% higher than last year. This is largely because the steady demand is concentrated around luxury apartments, so developers are building more luxury units that enter the market at a higher price and increase the city’s overall average rent. However, this increased supply is pushing the vacancy rate upward and pressuring property managers to offer more rent concessions to stay competitive.
Where Rents Are Dropping
Southwest Florida
Despite a quick plateau in the spring, rents continue to drop in Southwest Florida. The rental markets in Sarasota, Punta Gorda, Fort Myers, and Naples are still oversupplied, with vacancy rates almost double the national rate of 8.2%. Construction remains hot while demand stays steady, so renters can expect this area to remain a renter’s market for the foreseeable future.
Colorado
Lots of luxury apartments were added to the market circa 2024, spiking vacancy and pressuring property managers in upscale communities to drop rent to contend with new competition. Rent concessions are widespread across the state, making Colorado a true renter’s market; according to CoStar Group’s June 2026 report, about half of Denver’s multifamily communities are offering some sort of rent concession, and renters pay an average of 8.2% less than the advertised rent price after rent concessions are applied.
But unlike Sun Belt markets, where recent supply waves are largely due to leftover pandemic-era construction projects, much of Colorado’s development has a different driver.
In June 2022, Denver City Council passed the Expanding Housing Affordability (EHA) policy, which requires new residential communities to set aside between 8% and 15% of available units as affordable housing. This spurred a mad dash among developers to obtain building permits before the exemption deadline so they wouldn’t have to provide affordable housing as required by the EHA policy.
“That is one of the reasons why even though that was during a time that Denver’s population growth was actually slowing down, you saw that outsized development. A lot of it was legislatively driven instead of demand driven,” says Jeannie Tobin, CoStar Group’s director of market analytics in Colorado.
Tobin explains that developers are setting their sights on areas east of Denver, like Aurora, where construction costs are lower and Denver’s EHA policy doesn’t apply.
“There are some pretty strong demand drivers out there,” says Tobin. “That’s where a lot of Denver’s job growth has shifted.”
Washington, D.C.
While rents are rising in Baltimore and the Hampton Roads region of Virginia, Washington, D.C. and commuter cities in Northern Virginia are seeing a drop in prices as construction slows. At the end of June, rents in Washington, D.C. averaged 1.5% lower than June 2025, and rents in Arlington, VA, averaged 0.2% lower than June 2025.
Melina Duggal, senior director of market analytics for Washington, D.C. and Baltimore, attributes this to the job market in the D.C. area.
“The Washington region has experienced slower employment growth and heightened uncertainty surrounding federal jobs, which has weighed on household formation and apartment demand. At the same time, the market is still working through a significant wave of recent deliveries. Baltimore has generally faced fewer of those pressures,” she says.
Where Renters Are Searching
Most searched cities
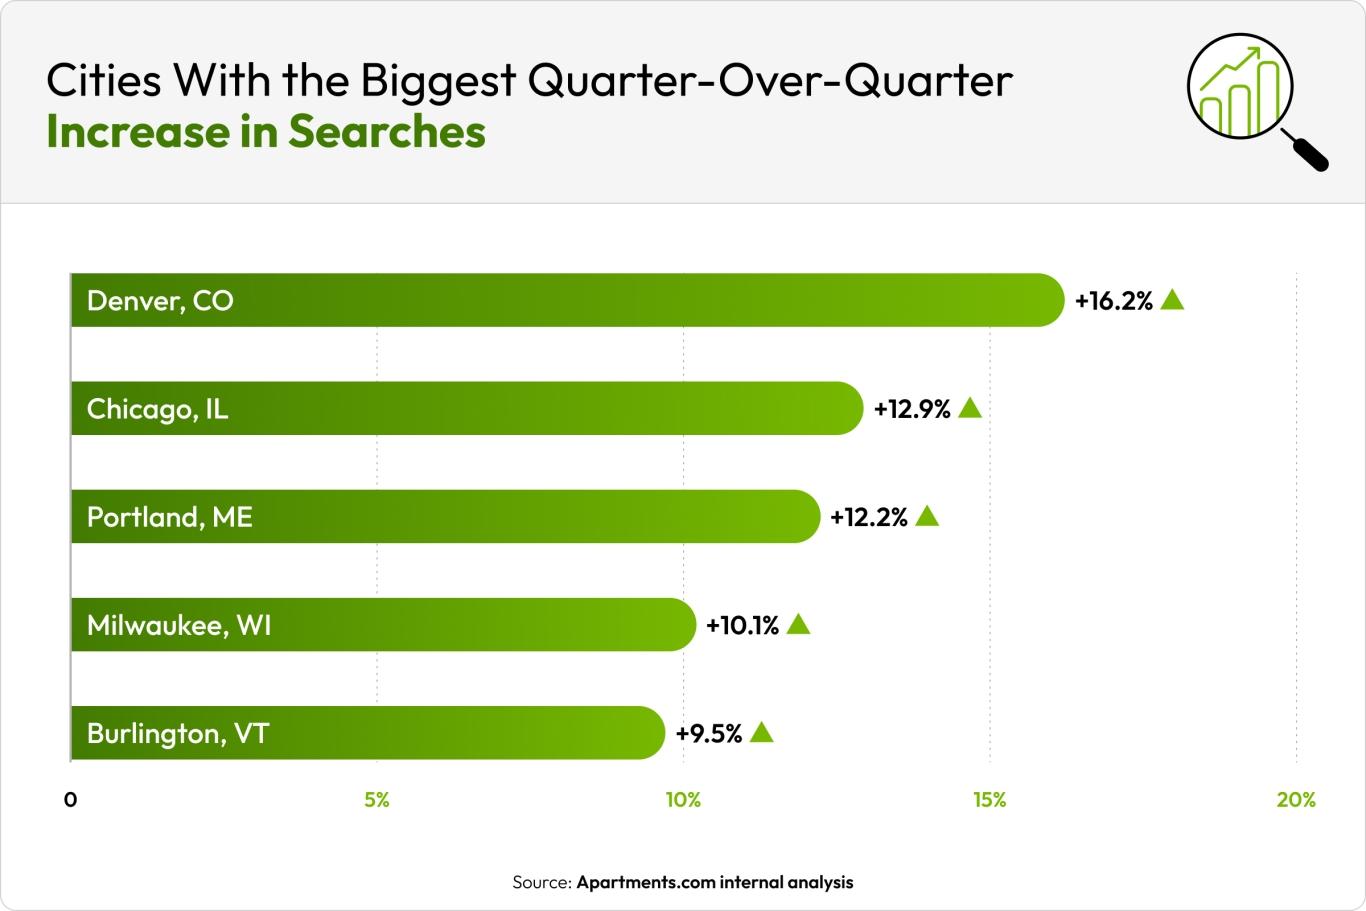
The five cities with the biggest quarter-over-quarter search increases were:
- Denver, CO (+16.2%)
- Chicago, IL (+12.9%)
- Portland, ME (+12.2%)
- Milwaukee, WI (+10.1%)
- Burlington, VT (+9.5%)
Searches increased in Denver and Chicago amidst opposite rental market conditions. In Denver, oversupply is driving up vacancy rates and pressuring property managers to offer deeper concessions, turning the city into a renter’s market. In Chicago, high demand is creating a constrained market, with rents up 4.4% over last year.
The five most-searched cities in the second quarter of 2026 were:
- New York, NY (+6.2%)
- Los Angeles, CA (+1.2%)
- Chicago, IL (+12.9%)
- Boston, MA (+8.1%)
- Dallas, TX (+3.2%)
Searches for rentals in Los Angeles gained some traction after a decline in the winter. This comes amid a relatively stagnant job market and unemployment rates above the national average.
Demand remains consistent overall despite economic uncertainty, but rent in LA has been stagnant due to increasing supply and rising vacancies, especially among luxury units. As the city’s economy grows more K-shaped, construction on luxury communities continues as renters opt for mid-tier units, creating supply side pressure among the luxury multifamily market.
Least searched cities
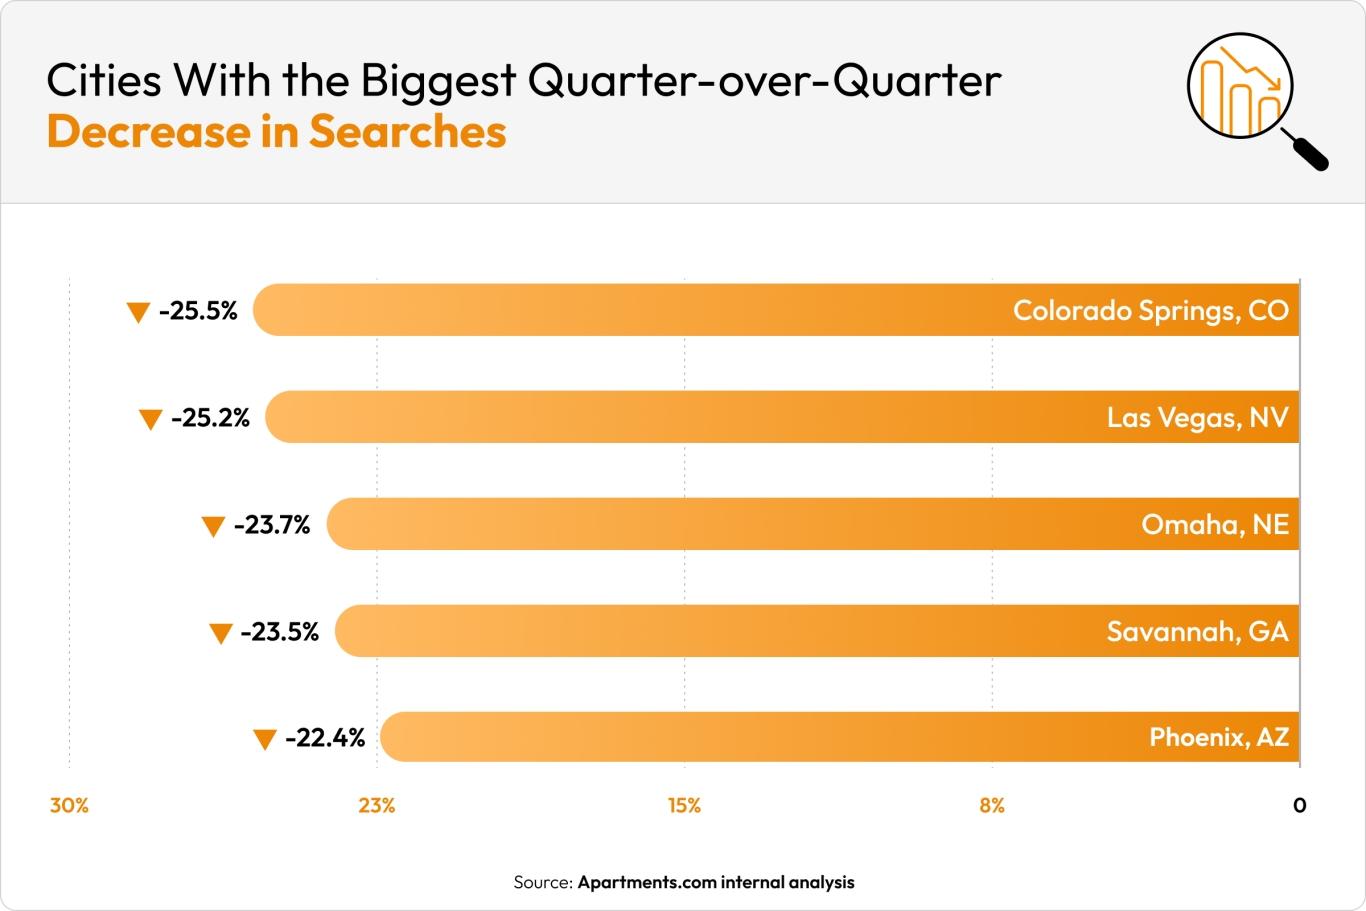
The five cities with the biggest quarter-over-quarter search decreases were:
- Colorado Springs, CO (-25.5%)
- Las Vegas, NV (-25.2%)
- Omaha, NE (-23.7%)
- Savannah, GA (-23.5%)
- Phoenix, AZ (-22.4%)
Phoenix’s rental market remains dry as apartment supply increases and demand trends downward. A 22.4% quarter-over-quarter decrease and an 11.5% vacancy rate at the height of moving season combined with declining rent and an 8% concession rate signal desperation among property managers to compete in an oversupplied market, giving renters the negotiating power in the apartment search.
The five least-searched cities in the second quarter of 2026 were:
- Flint, MI (+1.6%)
- Greenville, NC (+6.1%)
- Santa Barbara, CA (+4.8%)
- Springfield, MO (+8.1%)
- Chattanooga, TN (+1.4%)
While Santa Barbara, CA, fell on the lower end of renter searches on Apartments.com, search volume here increased by 4.8% over the beginning of 2026. Contrary to Los Angeles, the Santa Barbara area has seen significant economic growth.
“The local healthcare sector has been growing, which would spur apartment demand, while Goleta has become a hub for the aerospace and defense industries,” says Joshua Ohl, CoStar Group’s senior director of market analytics covering San Diego, Sacramento, and the Central Coast. “Umbra, for instance, just opened a new 50,000 square foot manufacturing facility in Goleta this past month that will build satellites.”
How Market Trends Impact Renters
Rent burden
According to CoStar Group’s National Market Report, the national median annual income is $84,906. According to the Rent Affordability Calculator, a renter making $84,906 a year—about $7,075 monthly—should spend no more than 2,123 per month on rent, and a one-bedroom apartment at the current average rent of $1,662 per month would take up only 23.5% of the $7,075 median monthly income.
While the national rent-to-income ratio is well under the suggested 30%, rent eats up more of renters’ income in many cities.
New York City remains the most unaffordable city for renters. Apartments.com reports that the median household income in New York is currently $71,116. If a renter making that median household income rented a one-bedroom apartment in New York at the current average rent of $4,188, they would be spending 70.6% of their income on rent. This marks a 1.3 percentage point increase over New York’s rent-to-income ratio in the first quarter of 2026.
Outside of New York, Boston, Miami, and Jersey City are the most unaffordable markets for renters. On the opposite side, Colorado Springs, Austin, Raleigh, and Portland are the most affordable cities for renters.
|
City |
Median Household Income |
Current Average One-Bedroom Rent |
Rent-to-Income Ratio |
|
$84,906 |
$1,662 |
23.5% |
|
|
$130,114 |
$2,393 |
22.1% |
|
|
$77,337 |
$1,651 |
25.6% |
|
|
$81,906 |
$1,421 |
20.8% |
|
|
$84,197 |
$3,636 |
51.8% |
|
|
$71,116 |
$1,646 |
27.8% |
|
|
$71,116 |
$3,064 |
51.7% |
|
|
$80,020 |
$1,923 |
28.8% |
|
|
$72,329 |
$1,478 |
24.5% |
|
|
$69,230 |
$2,055 |
35.6% |
|
|
$48,227 |
$1,147 |
28.5% |
|
|
$76,200 |
$1,303 |
20.5% |
|
|
$60,250 |
$1,184 |
23.6% |
|
|
$58,908 |
$1,411 |
28.7% |
|
|
$85,001 |
$1,633 |
23.1% |
|
|
$78,954 |
$2,283 |
34.7% |
|
|
$68,568 |
$1,268 |
22.2% |
|
|
$154,993 |
$3,861 |
29.9% |
|
|
$82,847 |
$1,747 |
25.3% |
|
|
$56,401 |
$1,183 |
25.2% |
|
|
$59,562 |
$1,132 |
22.8% |
|
|
$121,839 |
$2,972 |
29.3% |
|
|
$60,187 |
$1,304 |
26.0% |
|
|
$88,358 |
$3,274 |
44.5% |
|
|
$64,541 |
$1,263 |
23.5% |
|
|
$61,425 |
$1,268 |
24.8% |
|
|
$74,211 |
$1,848 |
29.9% |
|
|
$74,048 |
$2,186 |
35.4% |
|
|
$70,080 |
$1,523 |
26.1% |
|
|
$52,516 |
$2,248 |
51.4% |
|
|
$47,042 |
$1,223 |
31.2% |
|
|
$71,217 |
$1,425 |
24.0% |
|
|
$67,531 |
$1,701 |
30.2% |
|
|
$71,116 |
$4,186 |
70.6% |
|
|
$59,951 |
$1,591 |
31.8% |
|
|
$54,633 |
$1,787 |
39.3% |
|
|
$70,283 |
$1,302 |
22.2% |
|
|
$57,869 |
$1,444 |
29.9% |
|
|
$83,502 |
$1,528 |
22.0% |
|
|
$71,116 |
$3,592 |
60.6% |
|
|
$75,944 |
$1,394 |
22.0% |
|
|
$53,556 |
$1,439 |
32.2% |
|
|
$77,825 |
$1,575 |
24.3% |
|
|
$50,989 |
$1,159 |
27.3% |
|
|
$56,185 |
$1,071 |
22.9% |
|
|
$95,644 |
$2,427 |
30.5% |
|
|
$128,655 |
$3,514 |
32.8% |
|
|
$130,163 |
$2,829 |
26.1% |
|
|
$114,915 |
$2,116 |
22.1% |
|
|
$65,588 |
$1,651 |
30.2% |
|
|
$95,873 |
$2,288 |
28.6% |
National median household income data is based on CoStar Group’s National Market Report, and median household income is sourced from Apartments.com Area Guides. Median household income data is based on total metro area data, not renter-specific data. The average rent data is from Apartments.com Rent Trends pages.
Concession frequency
The national concession rate—the difference between advertised rent and actual rent paid after rent specials are applied—is up to 3.7%, 0.4 percentage points higher than last year. At the tail end of a relatively quiet summer moving season, renters are seeing lots of discounts and are paying an average of 3.7% less than the advertised price once rent specials are calculated.
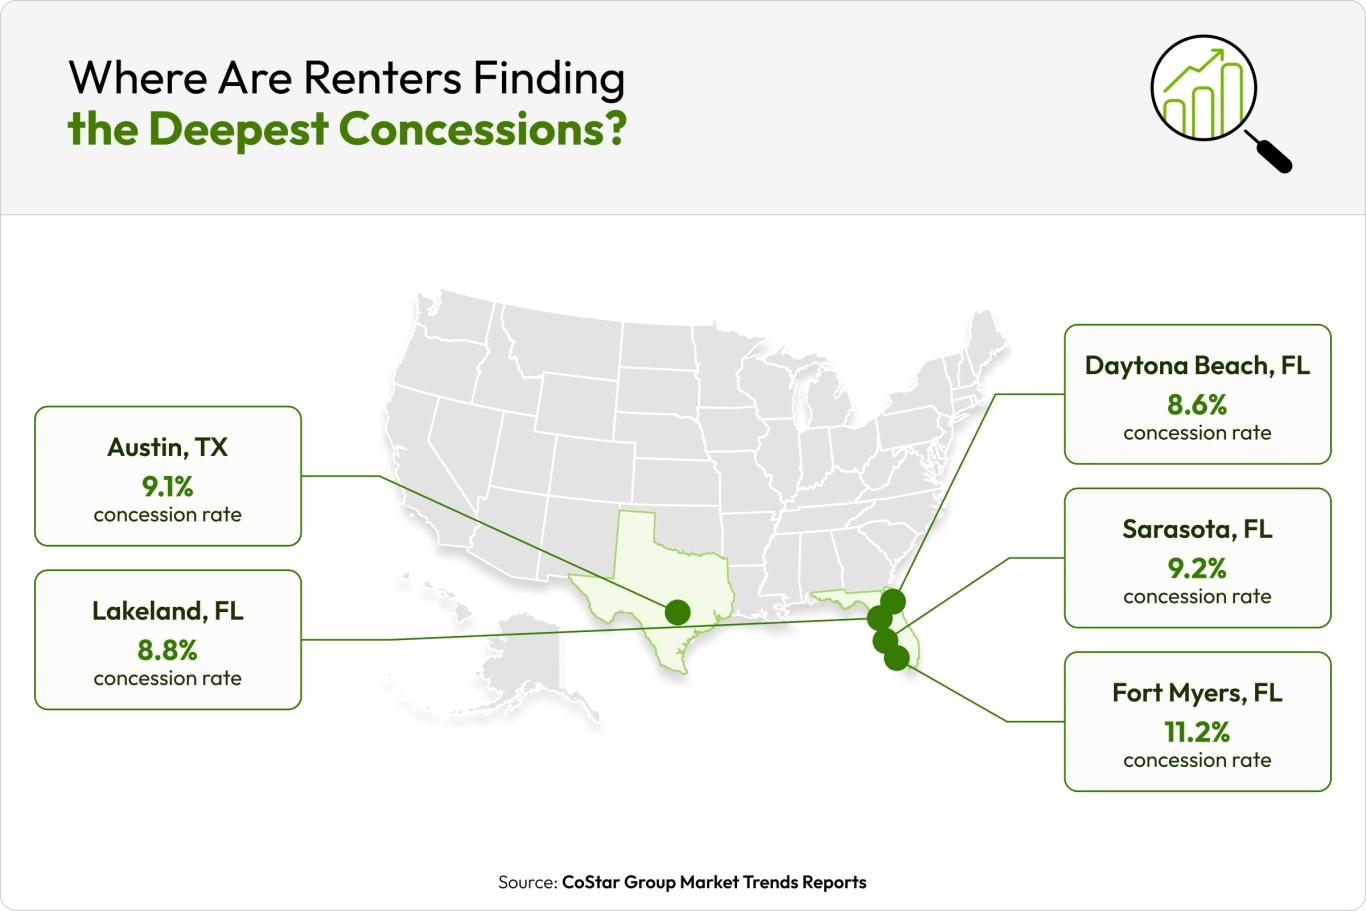
Where renters are finding the deepest concessions:
- Fort Myers, FL (11.2% concession rate)
- Sarasota, FL (9.2% concession rate)
- Austin, TX (9.1% concession rate)
- Lakeland, FL (8.8% concession rate)
- Daytona Beach, FL (8.6% concession rate)
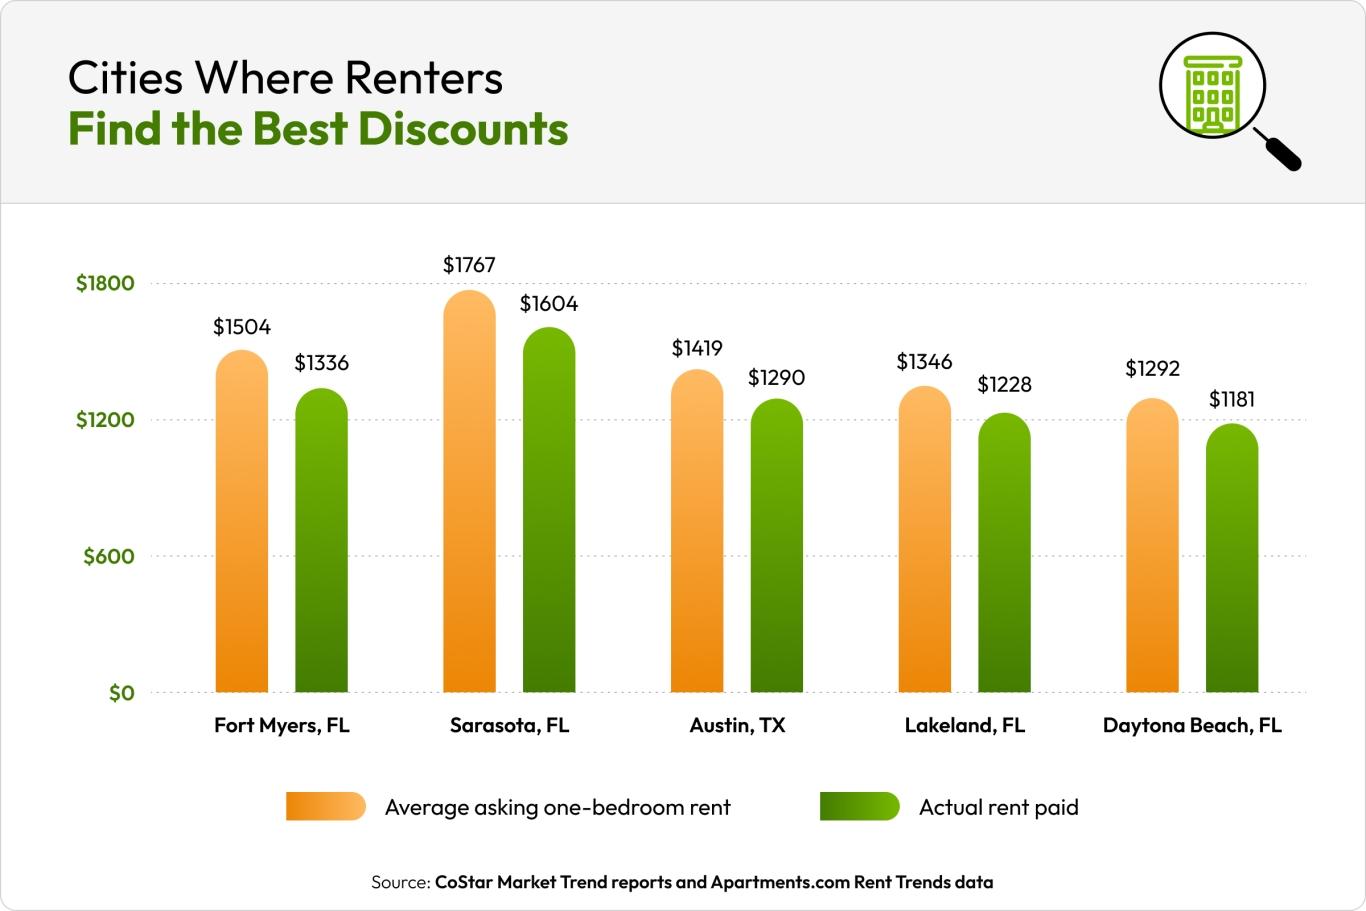
Bargains remain concentrated in the Sun Belt, with renters searching in Fort Myers finding the biggest discounts; on average, renters in Fort Myers are paying 11.2% less than the advertised price. This means that for an apartment listed at Fort Myers’ average one-bedroom rent of $1,504 per month, the average rent special would reduce a renter’s effective rent payments to $1,336 per month.
What We’re Watching
Increased oil prices
According to the Energy Information Administration, commercial crude oil inventories dropped to 7% below the five-year average in June. Renters may see increased utility bills this summer.
Illinois House Bill 3564
Illinois just passed House Bill 3564, which applies sweeping protections for tenants against excess fees.
The law particularly focuses on excess application fees, prohibiting landlords from charging more than $50 unless the cost of a third-party background check service is more than $50. If a landlord pays for the background check service upfront, they can bill the applicant for the cost within 14 days.
Under this law, landlords also cannot charge fees or fines for the following:
- Lease renewal
- Eviction notice or filing of an eviction before an eviction order is granted
- Routine maintenance, after-hours maintenance, maintenance hotlines, or travel required to complete maintenance and repairs,
- Pest removal if the tenant hasn’t contributed to the infestation
- In-person move-in or move-out walkthroughs.
HB 3564 was passed on June 26 and went into effect July 1.
Denver’s supply wave
Denver’s vacancy rate has been trending upward for the past few years, as construction ramped up despite stabilized demand. The passage of the EHA policy in 2022 added fuel to the fire, prompting developers to rush to break ground on new projects before it took effect. Now that the exemption deadline has passed, that supply wave has crested and construction has slowed.
"We could very quickly see a much different market where development slows down quite a bit, demand remains healthy, and we could see this supply wave being absorbed faster than anticipated."
Jeannie Tobin, Director of Market Analytics in Colorado, CoStar Group
Tobin says the EHA policy’s requirements could create a ripple effect throughout the city that could turn the market upside down in a few years.
“It’s going to be harder for developers to break ground in Denver going forward, so we could very quickly see a much different market where development slows down quite a bit, demand remains healthy, and we could see this supply wave being absorbed faster than anticipated, especially as we get further out,” says Tobin.
Tobin compares Denver’s EHA policy to the Inclusionary Housing program in Portland, OR, created in 2017 to address the city’s high housing costs: “Since then, they’ve struggled to have the development needed to support demand, and we could very well be headed in that direction in Denver.”
Methodology
Rent data is provided by CoStar Group’s Market Trend reports. As the industry leader in commercial real estate information, analytics, and news, CoStar conducts extensive research to produce and maintain a comprehensive database of commercial real estate information. We combine this data with public record to provide the most up-to-date rental information available.


