
Key Takeaways
- 64 percent of people say they would consider the monthly cost of housing, or the rent or mortgage, when picking their next area to live in. 56 say they would consider the daily cost of living.
- Of all their monthly expenses, 50 percent of U.S. adults say their groceries have increased in price the most over the last year.
- 35 percent of people changed their housing situation in 2025 because of inflation.
- Millennials are the most likely generation to have cut back on their household budget in 2025. They’re also the most likely generation to say they’re confident they’ll be able to afford their current living situation over the next 12 months.
If you've ever researched a neighborhood before making a big move, one of your first steps was probably looking up the cost of rent. But today, renters looking for a place to live have an almost equally important metric: the cost of milk and eggs there.
As everyday expenses like groceries and utilities grow more expensive, new data shows that more than half of U.S. adults say they would consider the daily cost of living when moving to a new area. Apartments.com's survey of over 1,200 people shows how important the cost of living has become to the rental search — and how inflation might keep some from moving at all.
Cost of Living and Utilities Now Top Drivers of Where People Live
Chances are, housing is the single biggest expense you pay each month. Because of that, 64 percent of people say they would consider the monthly cost of housing, or the rent or mortgage, when picking their next area to live in. It's the most common consideration in people's housing search.
But housing isn't the only costly expense to think about. Only a slightly smaller percentage (56 percent) of people would consider the daily cost of living (like groceries, dining out, and household items) when considering where to move. Similarly, 52 percent would consider utility costs.
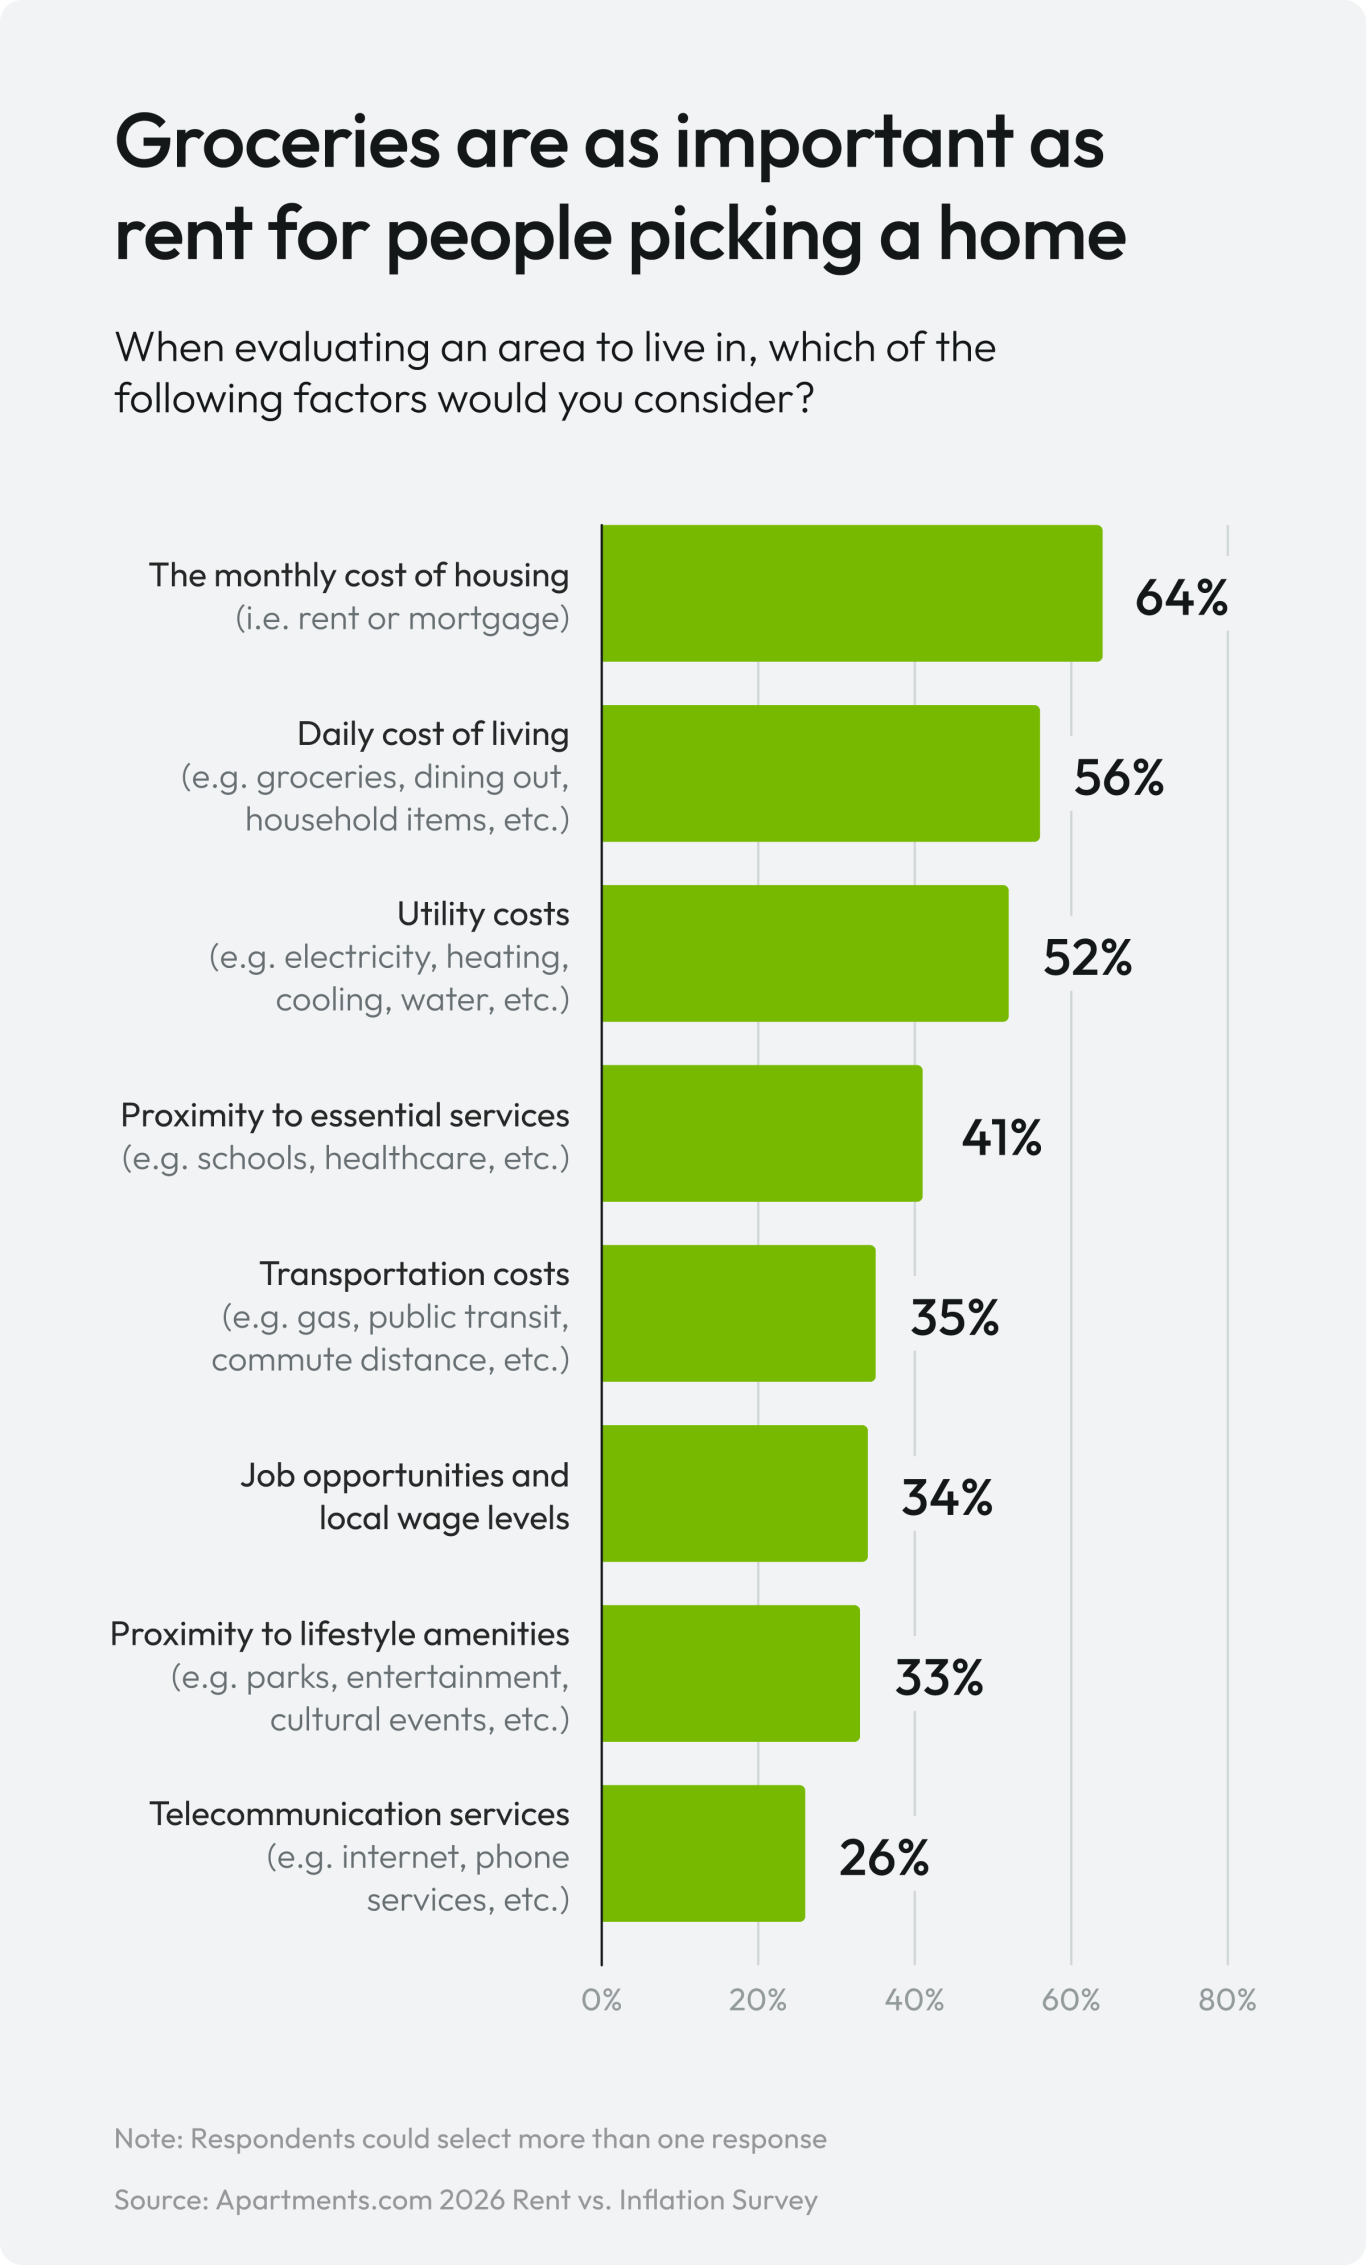
The high percentage of people considering everyday household goods in their move shows how important those expenses are today. Groceries keep getting more expensive, and it's making a big difference in whether people can live comfortably in a city.
Inflation Is Changing Household Budgets
People have been concerned about high prices for years. Inflation today isn't much higher than it was a year ago, according to the Bureau of Labor Statistics. But years of rising prices have compounded and wages have barely kept up, which makes it more difficult for many people to afford their bills.
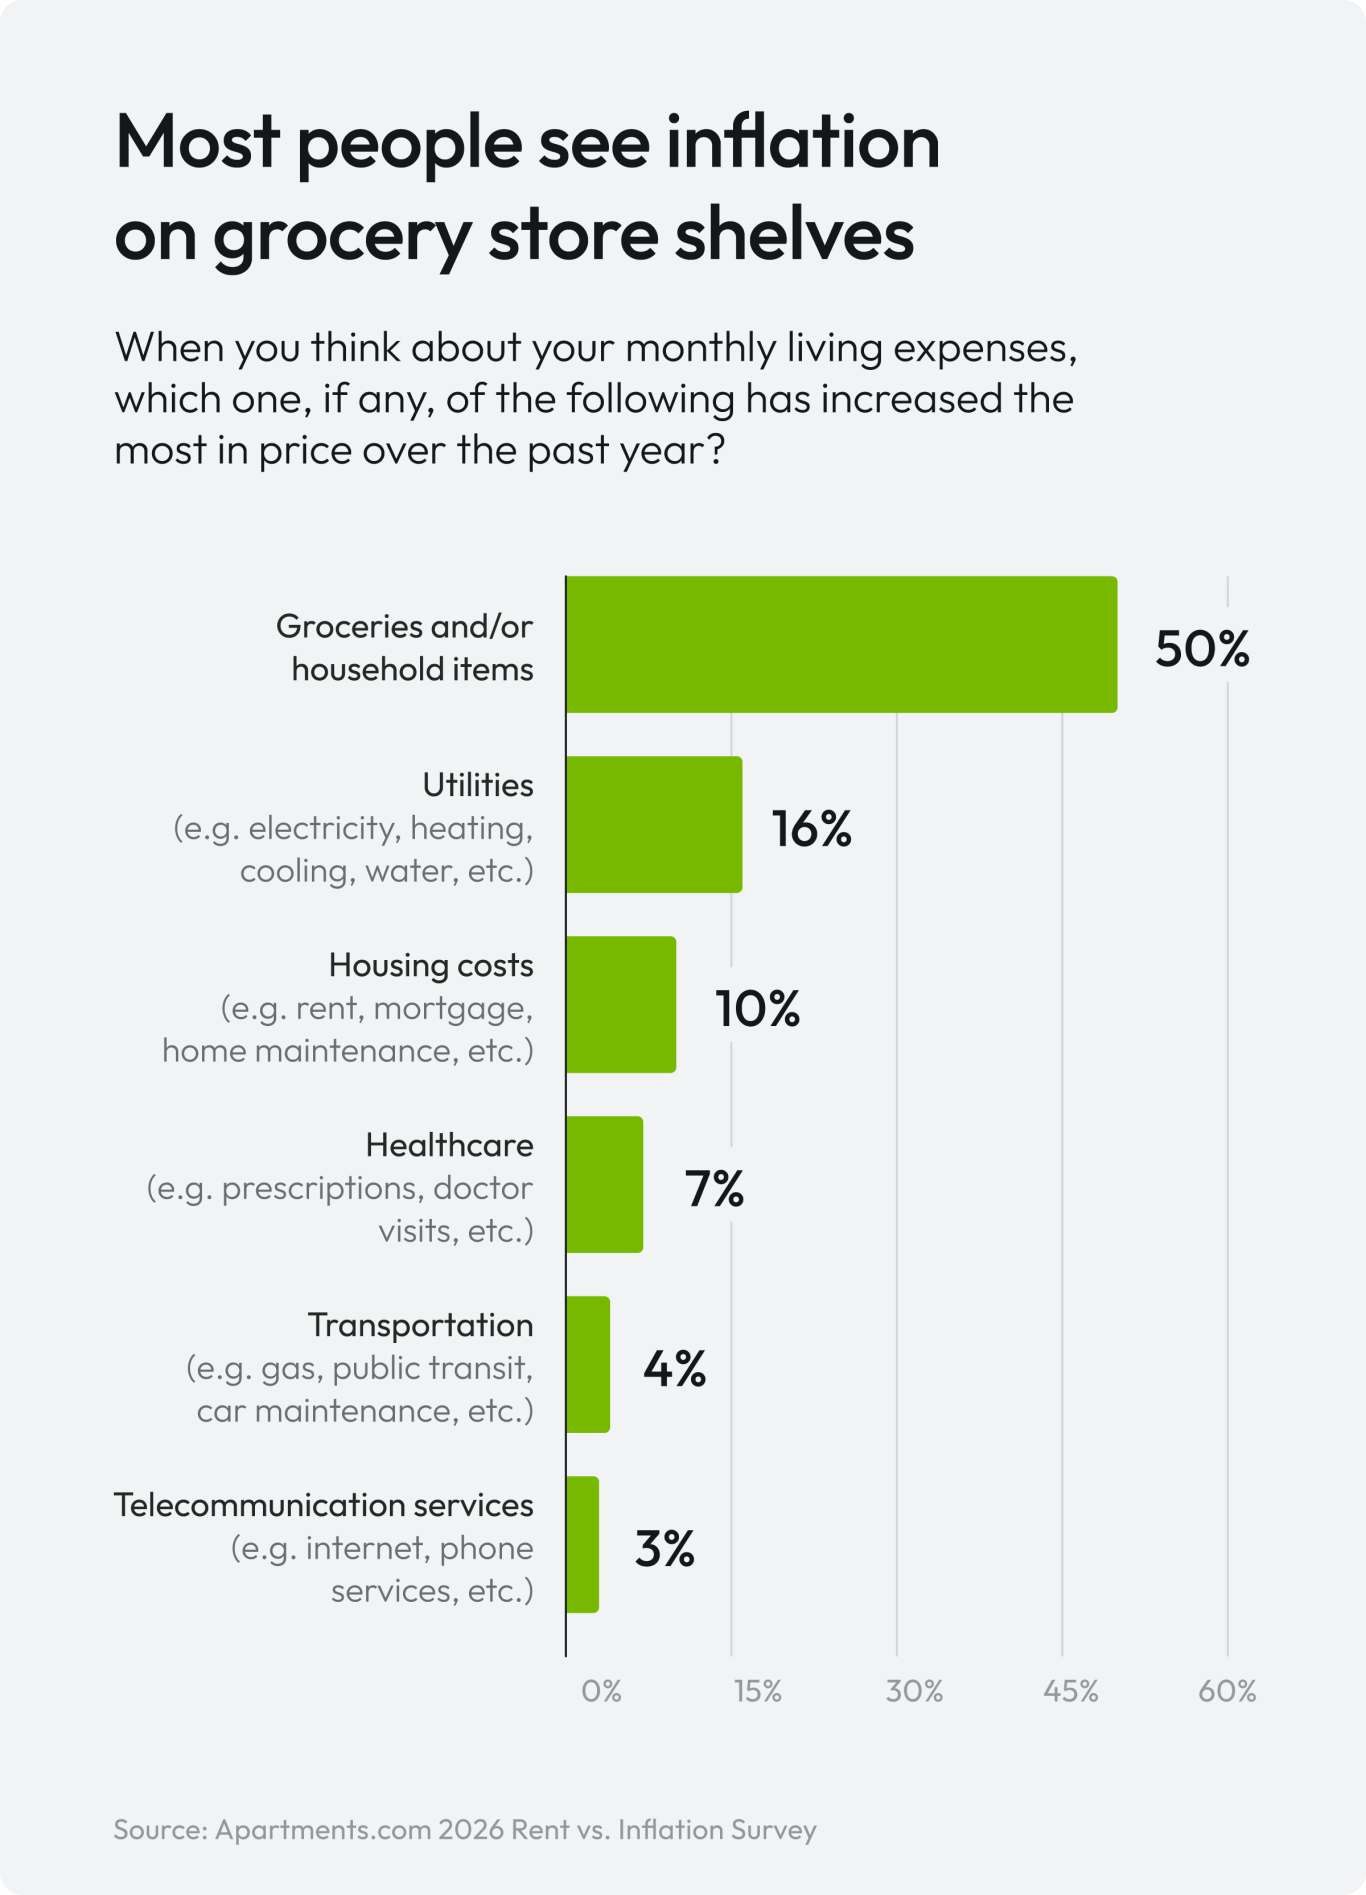
Technically, inflation just refers to the rising prices of all goods or services. But chances are, when we think of high prices today, we’re thinking of groceries. Of all their expenses, 50 percent of people say their groceries and household items increased in price the most over the past year.
The second-most commonly cited expense is utilities, but it was only mentioned by 16 percent of people. Groceries were also cited much more often than housing, even though rent typically costs more than groceries.
All in all, 90 percent of people say their monthly living expenses are more expensive than they were a year ago.
Around 3 in 4 People Say Inflation Has Impacted Their Household Budget
Around 3 in 4 (76 percent) people say inflation impacted their overall household budget in 2025. Most commonly, 34 percent of people cut back on non-essentials due to higher prices, and 23 percent cut back on essentials. Only 9 percent of people increased their overall household budget.
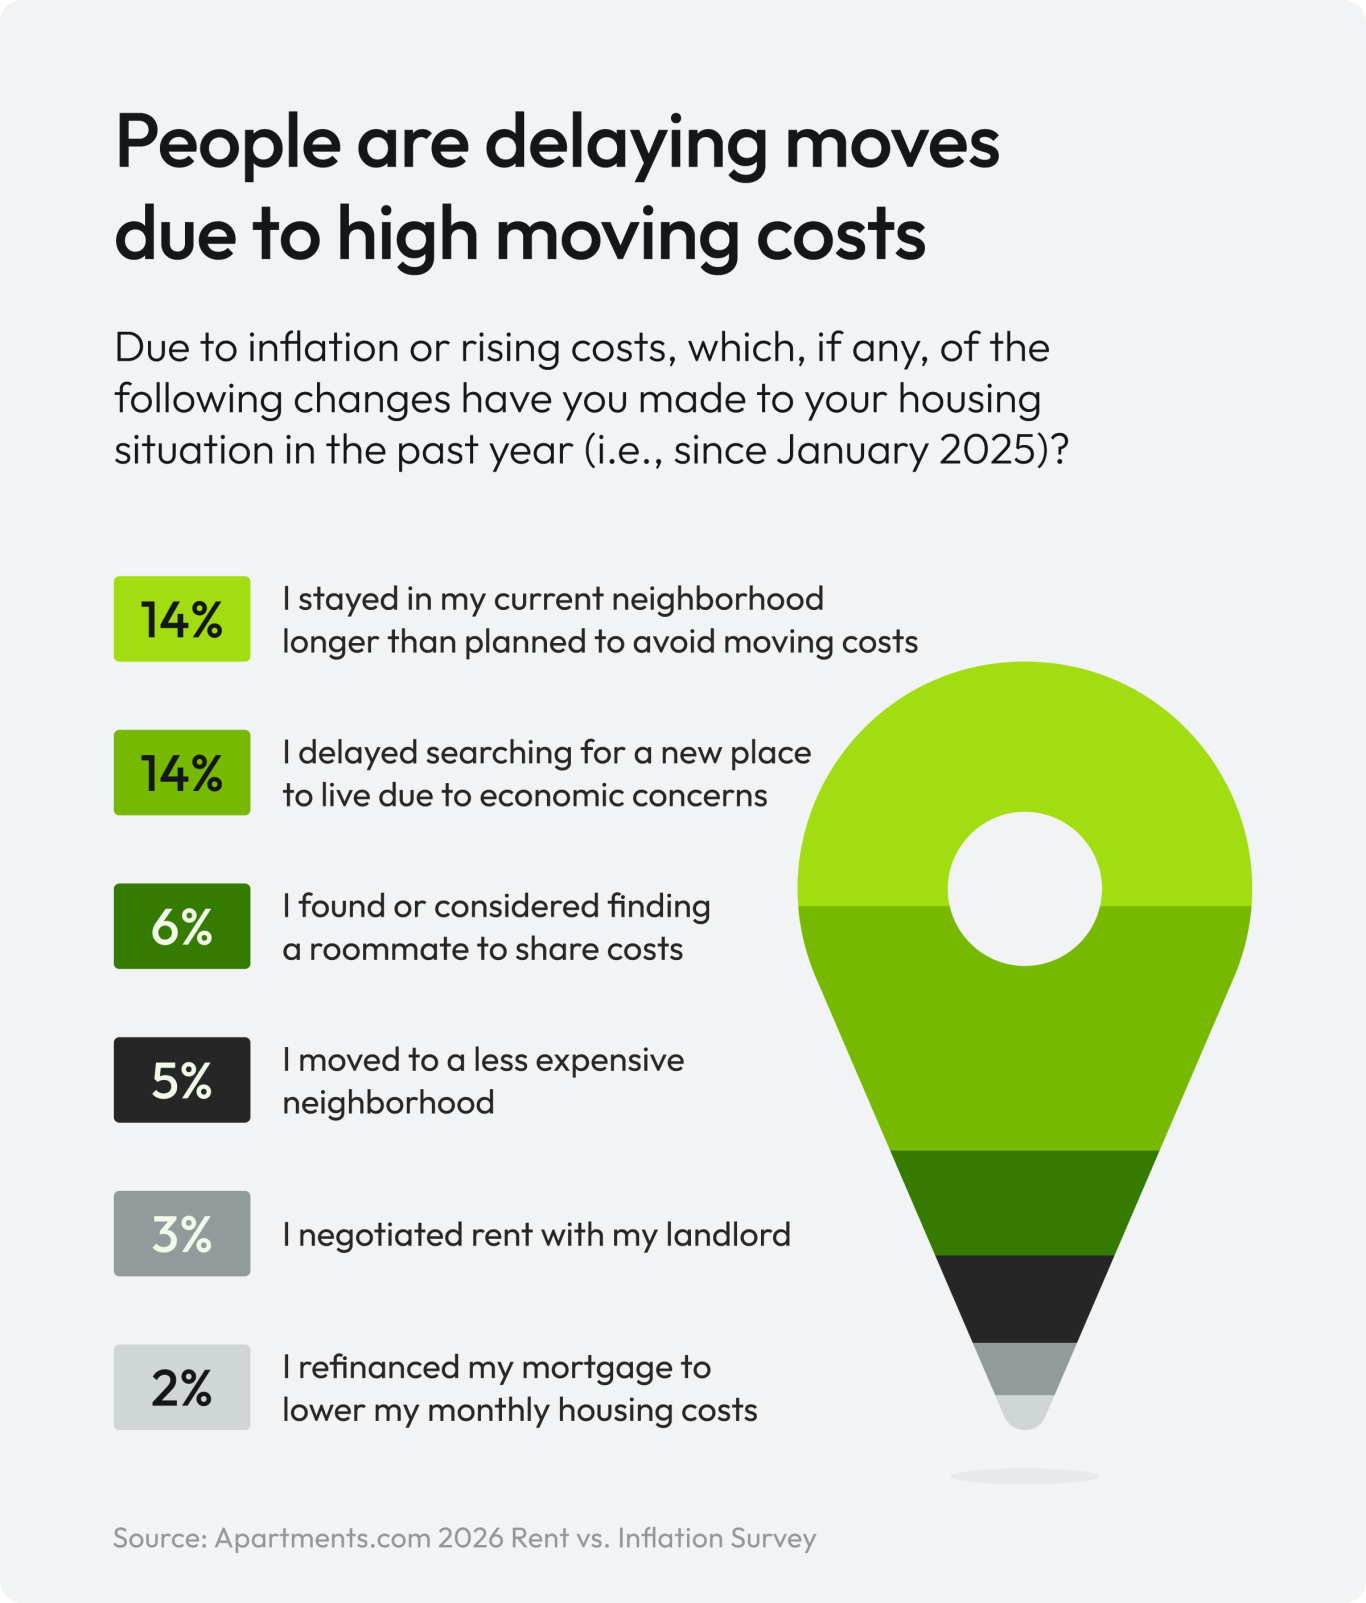
Higher prices don't just affect how much money we spend. They can also indirectly affect other financial choices, like how much we spend on rent: 35 percent of people say inflation and rising costs affected their housing situation in 2025.
Specifically, nearly 1 in 6 (14 percent) people stayed in their current neighborhood longer than originally planned to avoid moving costs and 14 percent delayed searching for a new place to live.
The high cost of moving might mean some people need to continue paying their current rent, even if it’s above budget. Over the last year, relatively few people moved to a less expensive neighborhood (5 percent) or negotiated rent with their landlord (3 percent):
Not being able to afford moving affects renters more acutely than people who own their homes. Renters are at risk of having their rents rise every year or needing to move out at a landlord’s discretion, and they likely have fewer assets than someone who owns their house. One in 5 (20 percent) renters say they stayed in their current neighborhood to avoid moving costs and 20 percent said they delayed searching for a new place to live. Compare that to 9 percent and 8 percent of homeowners, respectively.
Still, despite these additional costs, it’s clear that changing their budgets has given some people confidence this year. More than half (59 percent) of people are confident they’ll be able to afford their current living situation in 2026.
Millennials, in particular, may be seeing their savings efforts pay off. Millennials are the most likely generation to cut back on their household budget and 62 percent say they’re confident they’ll be able to afford their current living situation over the next 12 months.
Find Your Next Home That Fits Your Budget With Apartments.com
You'll need to consider more than rent when you pick your next apartment. That's where Apartments.com comes in. Apartments.com's in-depth property listings don't just stop at your monthly rent — they also guide you through the cost of utilities, pet rent, parking, and other fees, so you have a full understanding of how much you might pay after signing a lease.
What's more, our listings give you an overview of the neighborhood. Each listing has a quick snapshot of the best schools, transportation, parks, hospitals, and shopping in the area, so you have all the information you need to make the final decision. Check out our affordability calculator to determine your rental budget and let us help you find your next home.
Methodology
The survey on inflation's impact on housing is courtesy of YouGov Plc. All figures, unless otherwise stated, are from YouGov Plc. The total sample size was 1,248 adults. Fieldwork was undertaken between January 20 and January 21, 2026. The survey was carried out online. The figures have been weighted and are representative of all US adults (aged 18+).


