

With the cost of living continuing to rise across the country, many renters are turning to cost-cutting techniques to afford rent, such as living with a roommate or reducing spending in other areas.
While these strategies can help save money, some renters would still rather live alone and pay a premium than live with a roommate. In fact, an Apartments.com Roommate Affordability Survey found that 39 percent of U.S. adults would never feel comfortable living with a roommate.
Living without a roommate can be challenging, but it’s easier in some cities than others. A new Apartments.com analysis of median renter household income sourced from the U.S. Census Bureau’s 2024 American Community Survey 1-Year Estimates and one-bedroom asking rents provided by CoStar Group’s 2025 reports reveals the top 10 most affordable and most expensive metros in the U.S. for renters who want to live alone.
Key Takeaways
- Austin renters spend just 23.1% of their monthly income on rent, the lowest share among the 50 largest U.S. metros.
- Renters earning the median renter household income in New York would need to spend 52% of it on a one-bedroom apartment, making New York renters severely cost-burdened, according to the U.S Department of Housing and Urban Development (HUD).
- Only 24 of the 50 largest metros in the U.S. fall at or below the 30% rent affordability threshold, suggesting housing in large portions of the country is unaffordable for many renters.
Most Affordable Metros to Live Alone
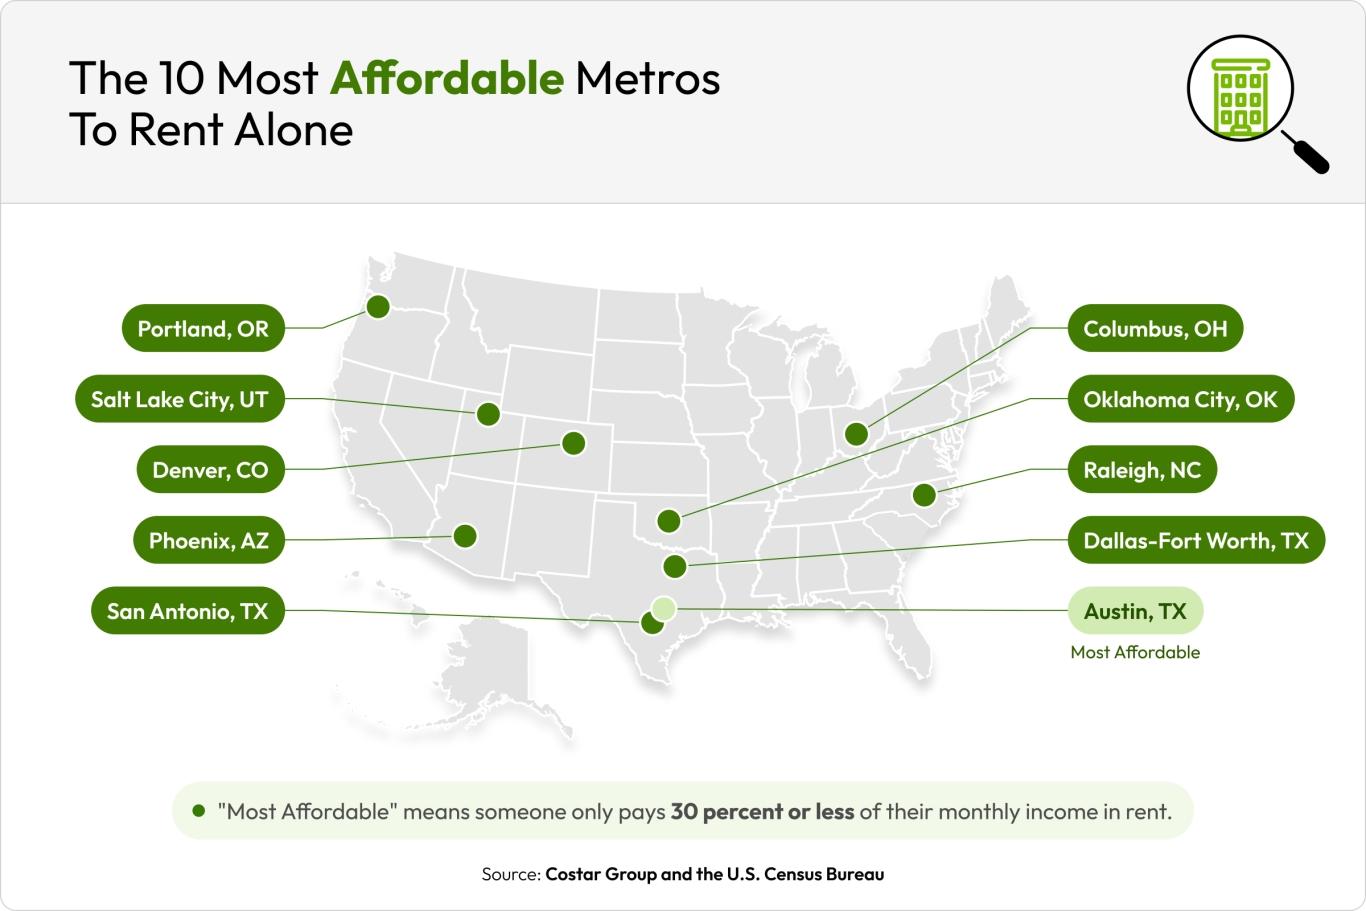
Common budgeting guidelines suggest that renters should spend no more than 30 percent of their monthly income on rent, so they have money for other costs, like groceries, bills, and savings. HUD classifies renters who spend more than 30 percent of their income on housing costs as “cost-burdened.” After analyzing median renter income and one-bedroom asking rents, Apartments.com found that renters can only afford to live alone in 24 of the 50 largest metros without crossing this 30 percent threshold. Here are the top five:

- Median Renter Household Income: $70,008
- One-Bedroom Monthly Asking Rent: $1,348/month
- Annual Percent of Income Spent on Rent: 23.1%
Austin renters spend the smallest share of income on a one-bedroom apartment of any major metro. The market is still favoring renters, with vacancy at 11.6 percent, as of Q3 2026 CoStar data. The average rent in Austin has decreased year over year and construction of new housing increased by 30 percent over the past decade. Tax incentives in Texas draw large tech corporations, like Google and Apple, to the Austin area, which has increased average wages, added more jobs to the local economy, and attracted renters in the process.

- Median Renter Household Income: $47,630
- One-Bedroom Monthly Asking Rent: $931/month
- Annual Percent of Income Spent on Rent: 23.5%
The cost of living in Oklahoma City is 18.8 percent lower than the national average, with basic household expenses like groceries, housing, utilities, and goods and services all falling below the U.S. average. Oklahoma City has experienced population growth and annual wage increases over the past year, according to the Census Bureau and the Bureau of Labor Statistics (BLS). Although rents in Oklahoma City have increased by 0.7 percent over the past year, average rents remain well below the national average.

- Median Renter Household Income: $66,322
- One-Bedroom Monthly Asking Rent: $1,393/month
- Annual Percent of Income Spent on Rent: 25.2%
Phoenix boasts a strong job market and low unemployment, with over 30 percent employment growth over the past decade. Arizona overall has a flat income tax and average rents have trended down by 1.2 percent over the past year. Although Phoenix’s cost of living is slightly above the national average, renters may find greater value and affordability in this Arizona city than in other Southwest markets like Los Angeles, where a one-bedroom averages $2,190.
- Median Renter Household Income: $64,948
- One-Bedroom Monthly Asking Rent: $1,374/month
- Annual Percent of Income Spent on Rent: 25.4%
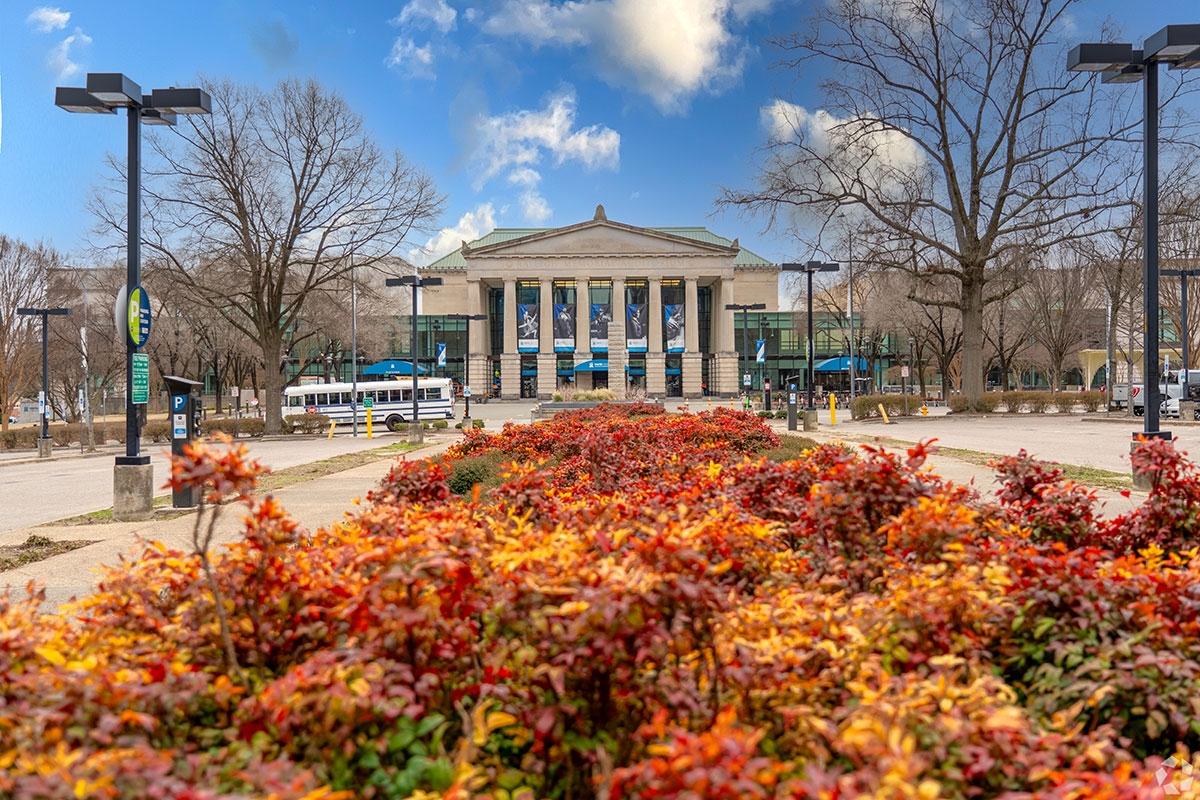
Rental housing construction in Raleigh peaked in 2018, with 47 percent of residential building permits issued belonging to new apartment developments, and this high level of construction continued after the 2020 pandemic. Now, many of these newly built units remain vacant, which has forced some landlords to lower rents and offer more rent concessions in response. Similar to Austin, Raleigh has plenty of employment opportunities for renters, with Duke University and Duke Health Systems alone employing more than 41,000 residents.
- Median Renter Household Income: $65,411
- One-Bedroom Monthly Asking Rent: $1,386/month
- Annual Percent of Income Spent on Rent: 25.4%
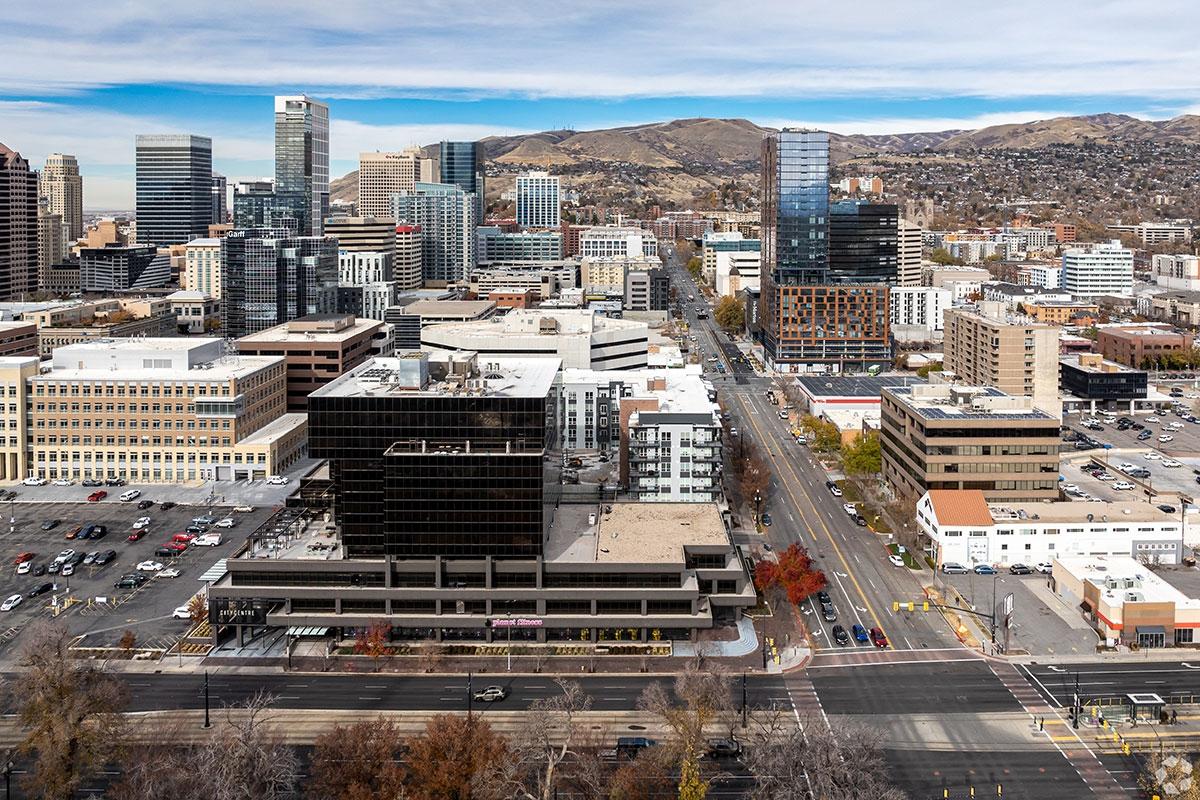
The average rent in Salt Lake City has decreased by 2.7 percent over the past year and the unemployment rate is lower than the national average at about 3.9 percent, based on recent analysis by the BLS. Utah’s tech corridor, nicknamed “Silicon Slopes,” is home to companies like Adobe and Qualtrics. Goldman Sachs also maintains a major office in SLC. With plenty of employment opportunities and lower asking rents that continue to decrease, Salt Lake City stands out as an affordable large metro.
Affordable Metros at a Glance
|
Metro |
Median Renter Household Income |
1-Bedroom Monthly Asking Rent |
Annual Percent of Income Spent on Rent |
|
Austin, TX |
$70,008 |
$1,348 |
23.1% |
|
Oklahoma City, OK |
$47,630 |
$931 |
23.5% |
|
Phoenix, AZ |
$66,322 |
$1,393 |
25.2% |
|
Raleigh, NC |
$64,948 |
$1,374 |
25.4% |
|
Salt Lake City, UT |
$65,411 |
$1,386 |
25.4% |
|
$51,029 |
$1,082 |
25.4% |
|
|
$63,172 |
$1,348 |
25.6% |
|
|
$72,520 |
$1,577 |
26.1% |
|
|
$68,355 |
$1,519 |
26.7% |
|
|
$52,075 |
$1,185 |
27.3% |
Source: U.S. Census Bureau and CoStar Group
Austin, San Antonio, and Dallas-Fort Worth all rank among the top 10 most affordable metros for renters to live alone, suggesting a favorable rental market in Texas. Factors contributing to lower rents may include recent high levels of construction, rising vacancy rates as renter demand catches up to supply, and fewer regulations, such as flexible zoning and lower development costs compared to other parts of the country.
Living alone has become a non-negotiable for many renters, and some renters are willing to make tradeoffs to afford this lifestyle. According to an Apartments.com survey, 16 percent of renters said they would rather live alone and pay more monthly rent than consider living with a roommate. Renters consider their living arrangements a top priority when searching for a rental and are willing to stretch their budget to accommodate their preferences.
Most Expensive Metros to Live Alone
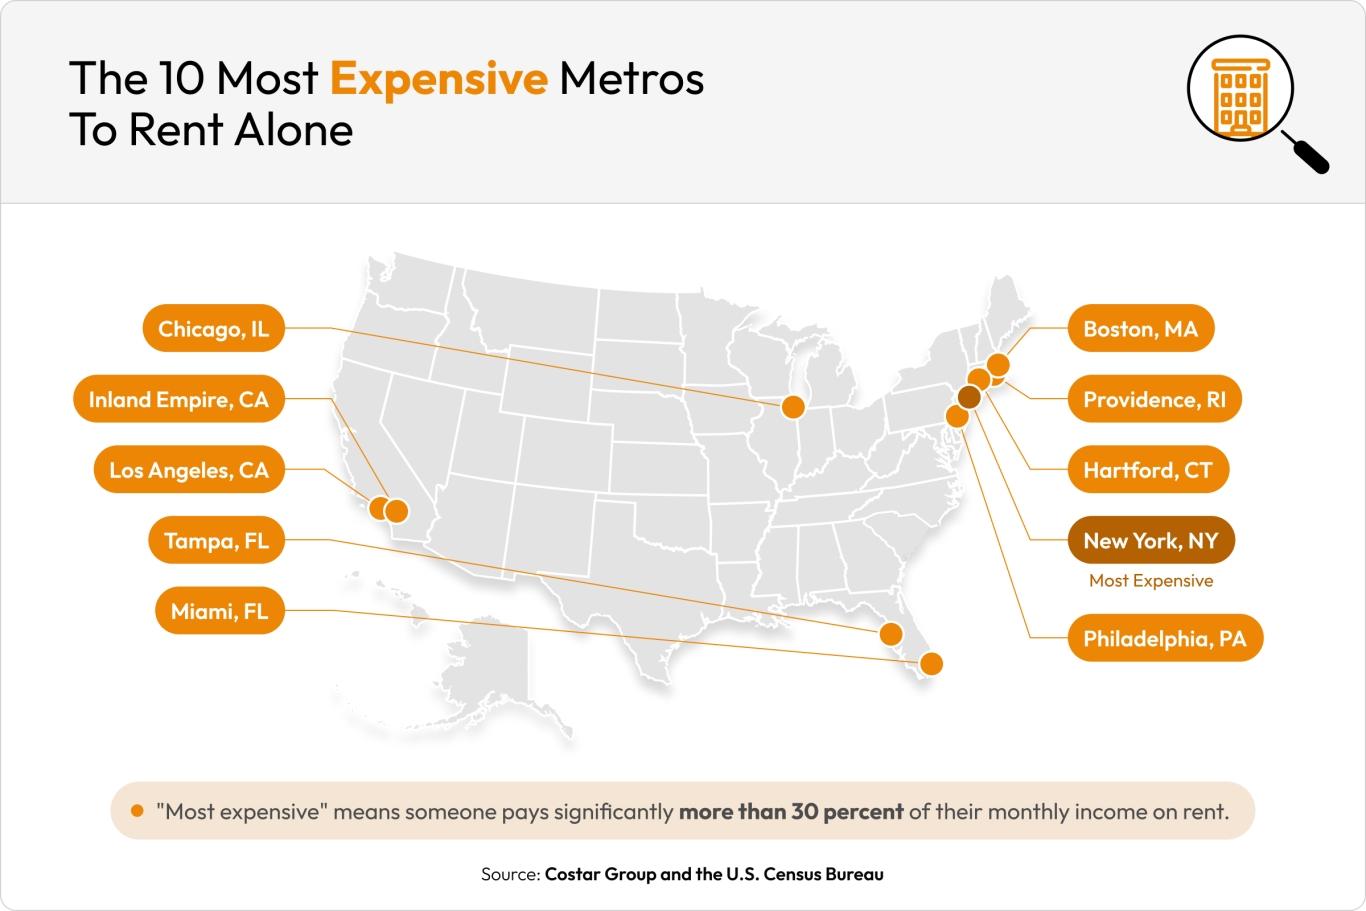
While there are a handful of metros where renters can find affordable options for living alone, many large metros are still expensive for renters looking to rent a one-bedroom apartment alone. Here are the top five most expensive metros to live alone based on monthly asking rents and median renter income:

- Median Renter Household Income: $66,983
- One-Bedroom Monthly Asking Rent: $2,904/month
- Annual Percent of Income Spent on Rent: 52%
With thousands of renters competing for housing, New York is one of the most expensive and in-demand markets in the U.S. today. CoStar Group reported that at the end of 2025, the vacancy rate in New York sat at just 2.9 percent with 47,685 units under construction. While demand remains steady, multifamily contractors are having difficulty keeping new housing construction on pace with high renter demand. The cost of building new multifamily housing in New York can range from $550 per square foot to $1,300 per square foot depending on location and housing type, making it costly for developers to add new units to the current housing supply.
To address rising costs and affordability concerns, the Rent Guidelines Board passed a citywide rent freeze for one- and two-year rent-stabilized leases earlier this year. This means that landlords operating in New York City cannot increase monthly rents on rent-stabilized leases starting between October 1, 2026, and September 30, 2027. Although this may increase competition for rent-stabilized apartments, the freeze can eliminate some guesswork renters face when it comes to rent increases.

- Median Renter Household Income: $49,067
- One-Bedroom Monthly Asking Rent: $1,839/month
- Annual Percent of Income Spent on Rent: 45%
Rents in Providence have increased by 2.1 percent over the past year while income has remained relatively stagnant, creating an affordability challenge for renters. The median renter household income in Providence is one of the lowest on this list, making it difficult for renters in Providence to afford housing costs alongside other basic living expenses. In fact, only seven of the state’s 39 municipalities met the statewide goal of 10 percent of housing being affordable, according to HousingWorks RI.
Despite cost increases throughout the state, the Rhode Island government is taking steps to address renters’ growing affordability concerns. The state minimum wage is set to increase by $1 in 2027, and local officials have expressed interest in expanding housing solutions, with a focus on affordable housing.
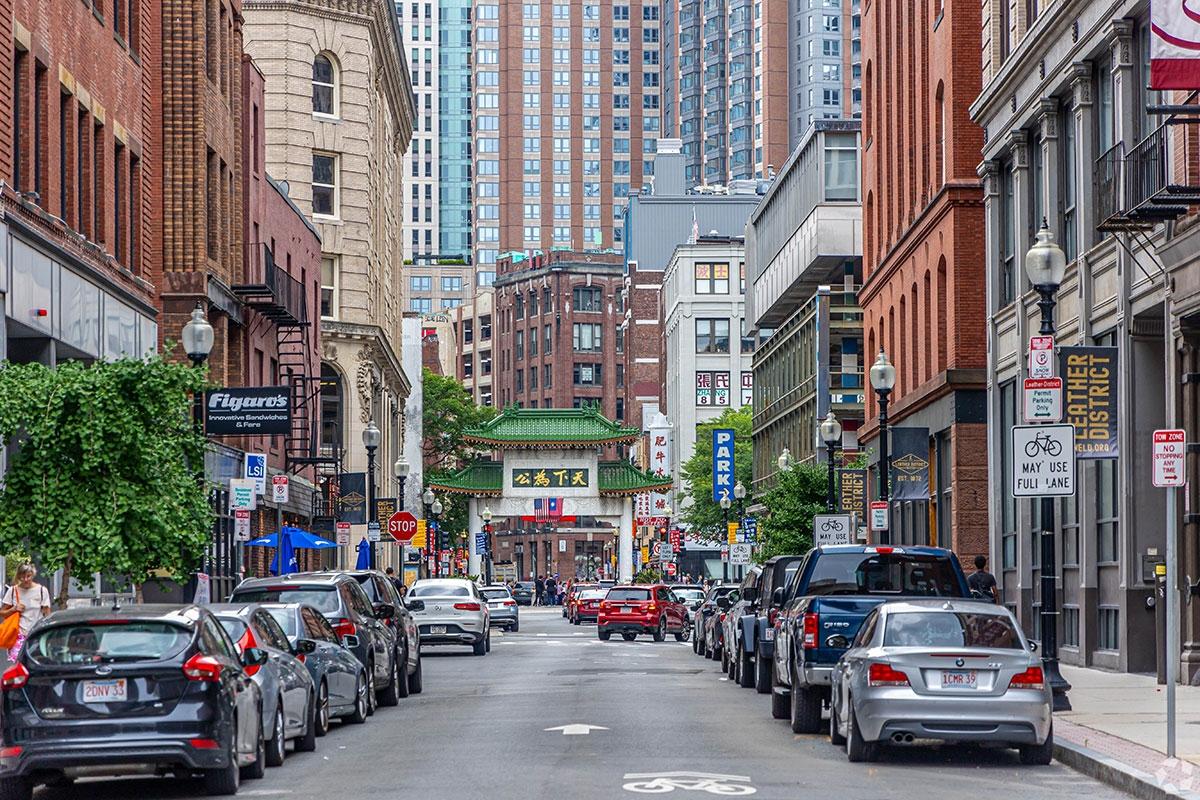
- Median Renter Household Income: $73,324
- One-Bedroom Monthly Asking Rent: $2,626/month
- Annual Percent of Income Spent on Rent: 43%
Although Boston renters earn the highest median household income in this analysis, they still have to spend over 43 percent of that income on average on rent. Despite higher rents, Boston still attracts renters looking for employment, as it's home to large companies like Fidelity Investments, Liberty Mutual, Toast, and DraftKings. Boston also attracts many student renters throughout the year with several universities located in and around the city, like Harvard University, Boston University, the Massachusetts Institute of Technology (MIT), and Northeastern University.
Although the Northeast region of the U.S. reported tighter rental markets and lower supply after the pandemic, the market is showing signs of stabilization. In the first quarter of 2026, the Northeast reported a 96.2 percent occupancy rate, outpacing other areas in the country.
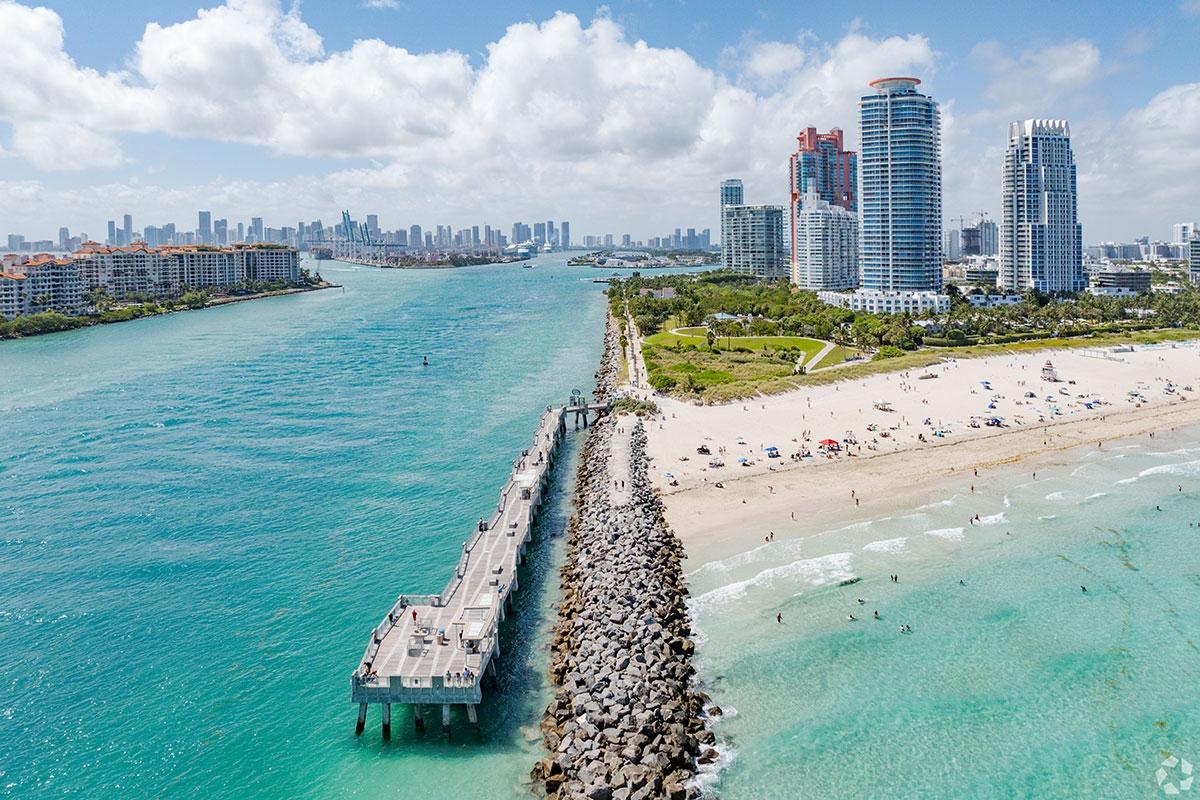
- Median Renter Household Income: $60,580
- One-Bedroom Monthly Asking Rent: $2,091/month
- Annual Percent of Income Spent on Rent: 41.4%
Miami and the greater South Florida area reported a 36 percent increase in the Consumer Price Index since 2019, according to the latest price comparison report from the Bureau of Labor Statistics. In addition to growing cost of living concerns, Florida has attracted higher-income homeowners who have been priced out of larger markets, such as New York and Los Angeles, in search of a more affordable lifestyle and lower taxes. This influx of new homeowners has left existing residents concerned about increased property insurance costs.
According to the U.S. Census Bureau, around 63 percent of renters in Miami are cost-burdened, meaning they spend more than 30 percent of their income on rent. With rents rising 1.5 percent over the past year and basic cost-of-living expenses like food and transportation rising by 7.3 percent, the Miami Herald reported that 56 percent of Miami households are living paycheck to paycheck.
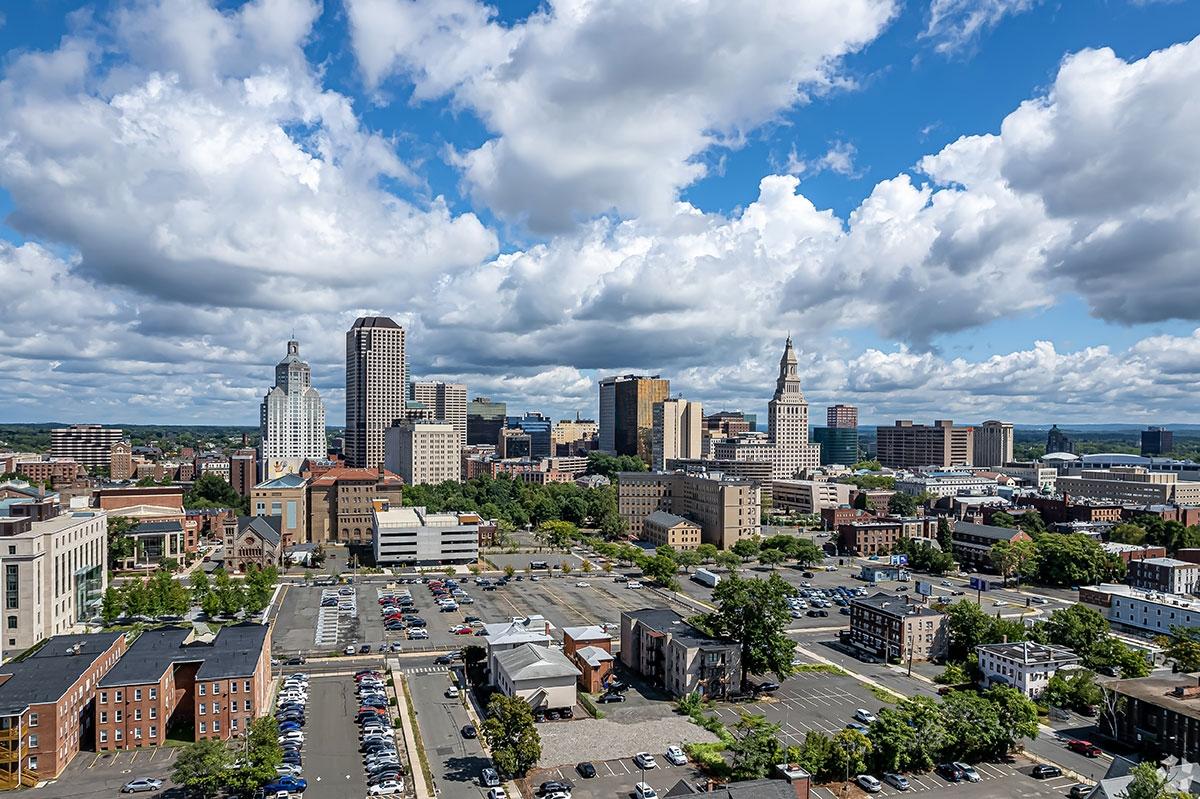
- Median Renter Household Income: $51,529
- One-Bedroom Monthly Asking Rent: $1,626/month
- Annual Percent of Income Spent on Rent: 37.9%
The vacancy rate in Hartford at the end of 2025 was 5.3 percent with an occupancy rate of 94.7 percent, suggesting that vacant units do not remain available for long. CoStar Group reported that construction completions in Hartford in 2025 fell more than 40 percent from the previous year. Although Hartford’s rental inventory has expanded, it is still relatively small compared to the larger inventories in Sun Belt markets.
Despite construction stalling and vacancies remaining low, Hartford still increased its rental inventory by 8 percent in 2025, adding nearly 5,400 units to the market. As of Q3 2026, Hartford has 2,778 units in the construction pipeline, suggesting that some renters may find more leverage in the coming months as leasing season slows.
Expensive Metros at a Glance
|
Metro |
Median Renter Household Income |
1-Bedroom Monthly Asking Rent |
Annual % of Income Spent on Rent |
|
New York, NY |
$66,983 |
$2,904 |
52% |
|
Providence, RI |
$49,067 |
$1,839 |
45% |
|
Boston, MA |
$73,324 |
$2,626 |
43% |
|
Miami, FL |
$60,580 |
$2,091 |
41.4% |
|
Hartford, CT |
$51,529 |
$1,626 |
37.9% |
|
$56,097 |
$1,766 |
37.8% |
|
|
$72,301 |
$2,190 |
36.3% |
|
|
$54,785 |
$1,657 |
36.3% |
|
|
$63,755 |
$1,871 |
35.2% |
|
|
$55,969 |
$1,618 |
34.7% |
Source: U.S. Census Bureau and CoStar Group
What Sets Affordable Metros Apart from Expensive Ones
Across the 50 largest metros in the U.S. used in this analysis, a few patterns stand out. Only 24 metros on this list fall at or under the 30 percent affordability threshold, suggesting that a large portion of the country’s rental stock is still too expensive for many renters on average wages.
Local laws, supply-and-demand trends, and rent history can provide an even closer look at why some metros are more affordable or more expensive than others.
Rent drives the affordability gap
One of the main differentiators between the most affordable metros and the most expensive ones is the average one-bedroom rent. The average median renter household income is about $62,100 in the most affordable metros and $60,400 in the least affordable. On the flip side, the average rent in the most affordable metros is $1,314, while that number rises to $2,019 in the most expensive.
Boston shows how this gap can play out. The median renter household income is $73,324, but a one-bedroom apartment costs $2,626 per month, meaning renters in the area would spend 43 percent of their monthly income on rent. Understanding how income impacts how much you should spend on rent can help you stay on budget during an apartment search.
Supply and rent trends affect affordability
Average rents are trending down in several of the most affordable metros and increasing in the more expensive ones. For example, average rents in Salt Lake City are down 2.7 percent year over year, while rents in Miami rose by 1.5 percent. New York’s vacancy rate sits at a low 2.9 percent, while Austin boasts a wide-open market with a vacancy rate of 11.6 percent as of Q3 2026.
The broader pattern among the least and most affordable metros on this list suggests that renters can find greater affordability and value in markets where construction has outpaced demand. This contributes to higher vacancies, as seen in Sun Belt markets, rather than metros with tight supply and continued demand, like Northeastern markets.
Lower rent doesn’t always mean affordable
Metros with lower asking rents are not always affordable. If local wages and incomes are too low or stagnant while average rents rise, a metro with lower rents may still be considered expensive. Consider Pittsburgh: the average one-bedroom rent is only $1,293, lower than top-ranked Austin, but the median income sits at $45,130, meaning renters would need to spend 34.4 percent of their median household income on rent.
While lower rents can signal affordability in many parts of the country, it’s important to look at the rental landscape as a whole. Consider rents in relation to supply and demand trends, vacancy rates, population, time of year, and employment opportunities to better determine whether a market truly offers affordability.
Find an Affordable Apartment on Apartments.com
If you’re looking for an apartment that falls within your rent budget, start your search on Apartments.com! You can filter your search based on the minimum and maximum amount you’re willing to spend on rent every month, so Apartments.com shows listings that match your search criteria.
If you need help determining your rental budget, you can use our Rent Affordability Calculator. Simply input your monthly pre-tax income and the percentage of that income you’re willing to spend on rent every month.
Sticking to your rental budget and finding an apartment that fits your needs is easy using Apartments.com.
Methodology
The median renter household income is sourced from the U.S. Census Bureau’s 2024 American Community Survey 1-Year Estimates, and one-bedroom asking rents and vacancy rate data are provided by CoStar Group 2025 reports. Year-over-year rent change is sourced from the Apartments.com Rent Trends pages.
To calculate the percentage of income spent on rent, we multiplied the monthly one-bedroom asking rent by 12, then divided the total by the median renter household income for each metro. To determine affordability, metros that scored 30 percent or below were considered affordable, and metros scoring higher than 30 percent were deemed expensive according to HUD’s affordability metrics. The analysis covers the 50 largest U.S. metros by population size.
FAQs
What are the most affordable metros to live alone in the U.S.?
The five most affordable metros for renters to live alone in the U.S. are Austin, Oklahoma City, Phoenix, Raleigh, and Salt Lake City. These metros were classified as the most affordable based on one-bedroom asking rents and median renter household income. Metros where renters would need to spend more than 30% of their income on rent were classified as expensive.
What is the most affordable metro to live alone?
The most affordable metro to live alone is Austin, Texas. Austin ranks as the most affordable metro in this analysis, with renters spending an estimated 23.1% of their income on rent, leaving more room in their budget for other basic living expenses, like groceries, transportation, bills, and savings.
What is the most expensive metro to live alone?
The most expensive metro to live alone is New York, New York. Based on the data in this analysis, renters living in New York would have to spend 52% of their income on rent. According to HUD's affordability metrics, renters in New York would be considered "severely cost-burdened" because they spend more than 50% of their income on rent.
How much of your income should you spend on rent?
A common budgeting guideline suggests spending no more than 30% of your monthly income on rent. The U.S. Department of Housing and Urban Development classifies households that spend more than 30% of their income on housing costs as cost-burdened.
If you want to figure out how much you should spend on rent every month, use Apartments.com’s Rent Affordability Calculator.


